Philips 2006 Annual Report Download - page 98
Download and view the complete annual report
Please find page 98 of the 2006 Philips annual report below. You can navigate through the pages in the report by either clicking on the pages listed below, or by using the keyword search tool below to find specific information within the annual report.-
 1
1 -
2
-
3
-
4
-
5
-
6
-
7
-
8
-
9
-
10
-
11
-
12
-
13
-
14
-
15
-
16
-
17
-
18
-
19
-
20
-
21
-
22
-
23
-
24
-
25
-
26
-
27
-
28
-
29
-
30
-
31
-
32
-
33
-
34
-
35
-
36
-
37
-
38
-
39
-
40
-
41
-
42
-
43
-
44
-
45
-
46
-
47
-
48
-
49
-
50
-
51
-
52
-
53
-
54
-
55
-
56
-
57
-
58
-
59
-
60
-
61
-
62
-
63
-
64
-
65
-
66
-
67
-
68
-
69
-
70
-
71
-
72
-
73
-
74
-
75
-
76
-
77
-
78
-
79
-
80
-
81
-
82
-
83
-
84
-
85
-
86
-
87
-
 88
88 -
 89
89 -
 90
90 -
 91
91 -
 92
92 -
 93
93 -
 94
94 -
 95
95 -
 96
96 -
 97
97 -
 98
98 -
 99
99 -
 100
100 -
 101
101 -
 102
102 -
 103
103 -
 104
104 -
 105
105 -
 106
106 -
 107
107 -
 108
108 -
109
-
110
-
111
-
112
-
113
-
114
-
115
-
116
-
117
-
118
-
119
-
120
-
121
-
122
-
123
-
124
-
125
-
126
-
127
-
128
-
129
-
130
-
131
-
132
-
133
-
134
-
135
-
136
-
137
-
138
-
139
-
140
-
141
-
142
-
143
-
144
-
145
-
146
-
147
-
148
-
149
-
150
-
151
-
152
-
153
-
154
-
155
-
156
-
157
-
158
-
159
-
160
-
161
-
162
-
163
-
164
-
165
-
166
-
167
-
168
-
169
-
170
-
171
-
172
-
173
-
174
-
175
-
176
-
177
-
178
-
179
-
180
-
181
-
182
-
183
-
184
-
185
-
186
-
187
-
188
-
189
-
190
-
191
-
192
-
193
-
194
-
195
-
196
-
197
-
198
-
199
-
200
-
201
-
202
-
203
-
204
-
205
-
206
-
207
-
208
-
209
-
210
-
211
-
212
-
213
-
214
-
215
-
216
-
217
-
218
-
219
-
220
-
221
-
222
-
223
-
224
-
225
-
226
-
227
-
228
-
229
-
230
-
231
-
232
-
233
-
234
-
235
-
236
-
237
-
238
-
239
-
240
-
241
-
242
-
243
-
244
 |
 |

Philips Annual Report 200698
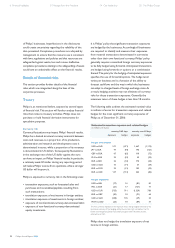
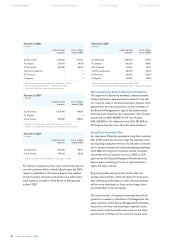
1) including plan and investments policy changes in 2006
2) after divestments of Semiconductors division and ETG
NPPC
The de-risking of the investment policy of the UK pension
fund during 2006 has reduced the NPPC-at-risk by about
EUR 45 million and the divestments have reduced it by
another EUR 45 million. These decreases were, however,
partly offset by the increase in equity markets during
2006, which has increased the sensitivity to changes in
equity prices and, as a consequence, also increased the
volatility of (the amortization of) gains and losses.
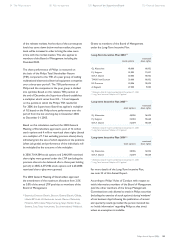
The country decomposition shows that the Dutch pension
fund contributes most to NPPC risk. This is attributable
to its size and its exposure to equities. The extra
contribution to the UK pension fund and the subsequent
reduction of its asset-liability mismatch have signifi cantly
lowered its contribution to total risk, while the divestments
primarily lowered the contribution of the Netherlands
to total risk.
On balance, in 2006, NPPC-at-risk decreased by about
EUR 65 million to EUR 95 million.
In summary, both the funded status-at-risk and the
NPPC-at-risk have decreased in 2006. This is attributable
to the reduced asset-liability mismatch of the UK pension
fund and the divestment of the Semiconductors division
and ETG. Developments in fi nancial markets, most notably
the increase in equity valuations, led to a small increase
in the total risk exposure. The Dutch pension fund
contributes most to the risk statistics, due to its size
and its exposure to equities.
1) including plan and investment policy changes in 2006
2) after divestment of Semiconductors division and ETG
Fiscal
Philips is, as mentioned before, exposed to fi scal
uncertainties. This section further describes this exposure.
Transfer pricing uncertainties
Philips has issued transfer pricing directives, which are
in accordance with guidelines of the Organization of
Economic Co-operation and Development. As transfer
pricing has a cross-border effect, the focus of local tax
authorities on implemented transfer pricing procedures
in a country may have an impact on results in another
country. In order to mitigate the transfer pricing
uncertainties, audits are executed on a regular basis
to safeguard the correct implementation of the transfer
pricing directives.
Tax uncertainties on general service agreements
Due to the centralization of certain activities in a limited
number of countries (such as research and development
costs, centralized costs for IT, and costs for corporate
functions and head offi ce) costs are also centralized.
As a consequence, for tax reasons these costs and / or
revenues must be allocated to the benefi ciaries, i.e. the
various Philips entities. For that purpose, apart from
specifi c allocation contracts for costs and revenues, general
service agreements (GSAs) are signed with a large number
of entities. Tax authorities review the implementation of
GSAs, often auditing on benefi t test for a particular country
or the use of tax credits attached to GSAs and royalty
payments, and may reject the implemented procedures.
Furthermore, buy in/out situations in case of (de)mergers
could affect the tax allocation of GSAs between countries.
The same applies to the specifi c allocation contracts.
6 Financial highlights 8 Message from the President 14 Our leadership 20 The Philips Group