Philips 2006 Annual Report Download - page 144
Download and view the complete annual report
Please find page 144 of the 2006 Philips annual report below. You can navigate through the pages in the report by either clicking on the pages listed below, or by using the keyword search tool below to find specific information within the annual report.-
 1
1 -
2
-
3
-
4
-
5
-
6
-
7
-
8
-
9
-
10
-
11
-
12
-
13
-
14
-
15
-
16
-
17
-
18
-
19
-
20
-
21
-
22
-
23
-
24
-
25
-
26
-
27
-
28
-
29
-
30
-
31
-
32
-
33
-
34
-
35
-
36
-
37
-
38
-
39
-
40
-
41
-
42
-
43
-
44
-
45
-
46
-
47
-
48
-
49
-
50
-
51
-
52
-
53
-
54
-
55
-
56
-
57
-
58
-
59
-
60
-
61
-
62
-
63
-
64
-
65
-
66
-
67
-
68
-
69
-
70
-
71
-
72
-
73
-
74
-
75
-
76
-
77
-
78
-
79
-
80
-
81
-
82
-
83
-
84
-
85
-
86
-
87
-
88
-
89
-
90
-
91
-
92
-
93
-
94
-
95
-
96
-
97
-
98
-
99
-
100
-
101
-
102
-
103
-
104
-
105
-
106
-
107
-
108
-
109
-
110
-
111
-
112
-
113
-
114
-
115
-
116
-
117
-
118
-
119
-
120
-
121
-
122
-
123
-
124
-
125
-
126
-
127
-
128
-
129
-
130
-
131
-
132
-
133
-
 134
134 -
 135
135 -
 136
136 -
 137
137 -
 138
138 -
 139
139 -
 140
140 -
 141
141 -
 142
142 -
 143
143 -
 144
144 -
 145
145 -
 146
146 -
 147
147 -
 148
148 -
 149
149 -
 150
150 -
 151
151 -
 152
152 -
 153
153 -
 154
154 -
155
-
156
-
157
-
158
-
159
-
160
-
161
-
162
-
163
-
164
-
165
-
166
-
167
-
168
-
169
-
170
-
171
-
172
-
173
-
174
-
175
-
176
-
177
-
178
-
179
-
180
-
181
-
182
-
183
-
184
-
185
-
186
-
187
-
188
-
189
-
190
-
191
-
192
-
193
-
194
-
195
-
196
-
197
-
198
-
199
-
200
-
201
-
202
-
203
-
204
-
205
-
206
-
207
-
208
-
209
-
210
-
211
-
212
-
213
-
214
-
215
-
216
-
217
-
218
-
219
-
220
-
221
-
222
-
223
-
224
-
225
-
226
-
227
-
228
-
229
-
230
-
231
-
232
-
233
-
234
-
235
-
236
-
237
-
238
-
239
-
240
-
241
-
242
-
243
-
244
 |
 |

Philips Annual Report 2006144
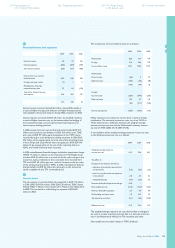
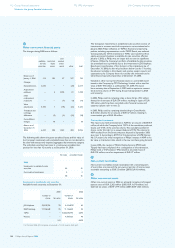
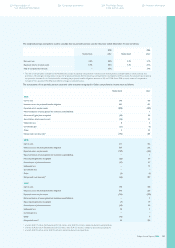
12
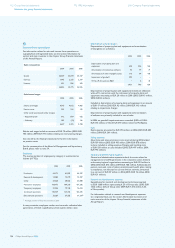
Other non-current fi nancial assets
The changes during 2006 are as follows:
available-
for-sale
securities
restricted
liquid
assets
cost-
method
invest-
ments other total
Balance as of
January 1, 2006 113 183 57 377 730
Changes:
Reclassifi cations 2,046 − − (29 ) 2,017
Acquisitions/
additions − 3 1,074 21 1,098
Sales/
redemptions/
reductions − − (7 ) (4 ) (11 )
Value
adjustments 4,370 1 (78 ) (61 ) 4,232
Translation and
exchange
differences − (5 ) (3 ) (20 ) (28 )
Consolidation
changes − 18 − − 18
Balance as of
December 31,
2006 6,529 200 1,043 284 8,056
The following table shows the gross unrealized losses and fair value of
the Company’s investments with unrealized losses that are not deemed to
be other-than-temporarily impaired, aggregated by investment category.
The individual securities have been in a continuous unrealized loss
position for less than 12 months as at December 31, 2006.
fair value unrealized losses
2006
Investments in available-for-sale
securities 62 31
Cost-method investments 6 4
68 35
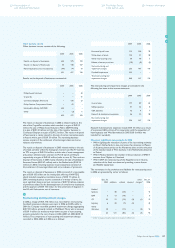
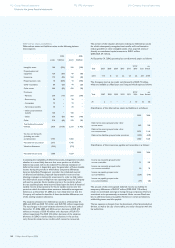
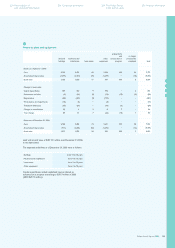
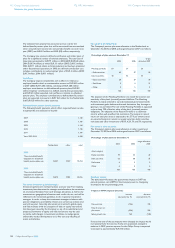
Investments in available-for-sale securities
Available-for-sale securities at December 31:
2005 2006
number of
shares fair value
number of
shares fair value
JDS Uniphase 39,318,996 78 4,914,875
1) 62
D&M Holdings 11,126,640 35 11,126,640 32
TSMC − − 4,066,046,793 6,395
Nuance − − 4,587,333 40
113 6,529
1) In October 2006, JDS Uniphase announced a 1 for 8 reverse stock split.
The Company’s investments in available-for-sale securities consist of
investments in common stock of companies in various industries. In
January 2006, Philips’ infl uence on TSMC’s fi nancial and operating
policies, including representation on the TSMC Board, was reduced.
Consequently, the 16.4% investment in TSMC was transferred from
equity-accounted investees to available-for-sale securities effective
January 1, 2006, as Philips was no longer able to exercise signifi cant
infl uence. Within the Company’s portfolio of available-for-sale securities,
the unrealized loss is primarily due to the investment in JDS Uniphase.
Based upon consideration of the duration of the impairment (as of
December 31, 2006, the fair value had been below cost for 7 months),
the inherent volatility in the industry and positive analyst reports and
expectations, the Company does not consider this investment to be
other-than-temporarily impaired as of December 31, 2006.
Included in other non-current fi nancial assets is a convertible bond
issued to the Company by TPV Technology Limited with a total fair
value of EUR 195 million as at December 31, 2006. The bond
has a maturity date of September 5, 2010 with an option to convert
the bond into shares of TPV during the period September 5, 2008
until maturity.
In 2005, Philips sold its remaining stake in Atos Origin (10.3 million
shares) for an amount of EUR 554 million, resulting in a gain of EUR
185 million, which has been recorded under fi nancial income and
expenses (please refer to note 5).
In 2005, Philips sold its remaining shareholding in Great Nordic
(6.8 million shares) for an amount of EUR 67 million, resulting in
a non-taxable gain of EUR 48 million.
Cost-method investments
The major cost-method investment is NXP, for an amount of EUR 854
million, of which the Company holds 19.9% of the cumulative preferred
shares and 17.5% of the common shares. The cumulative preferred
shares confer the right to an annual dividend of 10%. The interest in
NXP resulted from the Semiconductors disposal in September 2006
(see note 1). According to EITF 01-2 ‘Interpretations of APB Opinion
No. 29’, issue 6, the initial recognition of Philips’ interest in NXP is the
fair value at transaction date, which is the new cost basis going forward.
In June 2006, the merger of Mobile Display Systems (MDS) with
Toppoly has been completed. As a consequence of the transaction,
Philips holds a 17.5% stake in TPO, valued at amortized cost of
EUR 103 million, net of an impairment of EUR 77 million.
13
Non-current receivables
Non-current receivables include receivables with a remaining term
of more than one year, and the non-current portion of income taxes
receivable amounting to EUR 25 million (2005: EUR 10 million).
14
Other non-current assets
Other non-current assets in 2006 are primarily comprised of prepaid
pension costs of EUR 2,262 million (2005: EUR 1,676 million) and
deferred tax assets of EUR 1,144 million (2005: EUR 1,523 million).
112 Group fi nancial statements
Notes to the group fi nancial statements
172 IFRS information 218 Company fi nancial statements