General Motors 2012 Annual Report Download - page 101
Download and view the complete annual report
Please find page 101 of the 2012 General Motors annual report below. You can navigate through the pages in the report by either clicking on the pages listed below, or by using the keyword search tool below to find specific information within the annual report.-
 1
1 -
2
-
3
-
4
-
5
-
6
-
7
-
8
-
9
-
10
-
11
-
12
-
13
-
14
-
15
-
16
-
17
-
18
-
19
-
20
-
21
-
22
-
23
-
24
-
25
-
26
-
27
-
28
-
29
-
30
-
31
-
32
-
33
-
34
-
35
-
36
-
37
-
38
-
39
-
40
-
41
-
42
-
43
-
44
-
45
-
46
-
47
-
48
-
49
-
50
-
51
-
52
-
53
-
54
-
55
-
56
-
57
-
58
-
59
-
60
-
61
-
62
-
63
-
64
-
65
-
66
-
67
-
68
-
69
-
70
-
71
-
72
-
73
-
74
-
75
-
76
-
77
-
78
-
79
-
80
-
81
-
82
-
83
-
84
-
85
-
86
-
87
-
88
-
89
-
90
-
 91
91 -
 92
92 -
 93
93 -
 94
94 -
 95
95 -
 96
96 -
 97
97 -
 98
98 -
 99
99 -
 100
100 -
 101
101 -
 102
102 -
 103
103 -
 104
104 -
 105
105 -
 106
106 -
 107
107 -
 108
108 -
 109
109 -
 110
110 -
 111
111 -
112
-
113
-
114
-
115
-
116
-
117
-
118
-
119
-
120
-
121
-
122
-
123
-
124
-
125
-
126
-
127
-
128
-
129
-
130
-
131
-
132
-
133
-
134
-
135
-
136
-
137
-
138
-
139
-
140
-
141
-
142
-
143
-
144
-
145
-
146
-
147
-
148
-
149
-
150
-
151
-
152
-
153
-
154
-
155
-
156
-
157
-
158
-
159
-
160
-
161
-
162
-
163
-
164
-
165
-
166
-
167
-
168
-
169
-
170
-
171
-
172
-
173
-
174
-
175
-
176
-
177
-
178
-
179
-
180
-
181
-
182
 |
 |

GENERAL MOTORS COMPANY AND SUBSIDIARIES
NOTES TO CONSOLIDATED FINANCIAL STATEMENTS — (Continued)
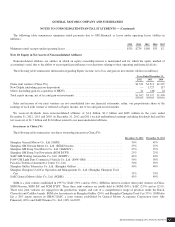
(b) Represents our seven percent ownership in PSA acquired in connection with our agreement with PSA to create a long-term and
strategic alliance. The investment is recorded in Other assets.
December 31, 2011
Unrealized Fair Value Measurements on a Recurring Basis
Cost Gains Losses
Fair
Value Level 1 Level 2 Level 3
Cash and cash equivalents
Available-for-sale securities
U.S. government and agencies ................. $ 239 $— $— $ 239 $ — $ 239 $—
Sovereign debt .............................. 490 — — 490 — 490 —
Certificates of deposit ........................ 2,028 — — 2,028 — 2,028 —
Money market funds ......................... 1,794 — — 1,794 1,794 — —
Corporate debt .............................. 5,112 — — 5,112 — 5,112 —
Total available-for-sale securities ................. $ 9,663 $— $— 9,663 1,794 7,869 —
Trading securities
Sovereign debt .............................. 497 — 497 —
Total trading securities ......................... 497 — 497 —
Total marketable securities classified as cash
equivalents ................................. 10,160 $1,794 $ 8,366 $—
Cash, time deposits and other cash equivalents ...... 5,911
Total cash and cash equivalents .................. $16,071
Marketable securities — current
Available-for-sale securities
U.S. government and agencies ................. $ 5,214 $ 2 $— $ 5,216 $ — $ 5,216 $—
Sovereign debt .............................. 143 — — 143 — 143 —
Certificates of deposit ........................ 178 — — 178 — 178 —
Corporate debt .............................. 4,566 3 4 4,565 — 4,565 —
Total available-for-sale securities ................. $10,101 $ 5 $ 4 10,102 — 10,102 —
Trading securities
Equity .................................... 34 34 — —
Sovereign debt .............................. 5,936 — 5,936 —
Other debt ................................. 76 — 76 —
Total trading securities ......................... 6,046 34 6,012 —
Total marketable securities — current ............. $16,148 $ 34 $16,114 $—
Restricted cash and marketable securities
Available-for-sale securities
Money market funds ......................... $ 1,363 $— $— $ 1,363 $1,363 $ — $—
Sovereign debt .............................. 15 — — 15 — 15 —
Other ..................................... 161 3 — 164 — 164 —
Total marketable securities classified as restricted cash
and marketable securities ..................... $ 1,539 $ 3 $— 1,542 $1,363 $ 179 $—
Restricted cash, time deposits and other restricted cash
equivalents ................................. 691
Total restricted cash and marketable securities ....... $ 2,233
General Motors Company 2012 ANNUAL REPORT98