General Motors 2012 Annual Report Download - page 136
Download and view the complete annual report
Please find page 136 of the 2012 General Motors annual report below. You can navigate through the pages in the report by either clicking on the pages listed below, or by using the keyword search tool below to find specific information within the annual report.-
 1
1 -
2
-
3
-
4
-
5
-
6
-
7
-
8
-
9
-
10
-
11
-
12
-
13
-
14
-
15
-
16
-
17
-
18
-
19
-
20
-
21
-
22
-
23
-
24
-
25
-
26
-
27
-
28
-
29
-
30
-
31
-
32
-
33
-
34
-
35
-
36
-
37
-
38
-
39
-
40
-
41
-
42
-
43
-
44
-
45
-
46
-
47
-
48
-
49
-
50
-
51
-
52
-
53
-
54
-
55
-
56
-
57
-
58
-
59
-
60
-
61
-
62
-
63
-
64
-
65
-
66
-
67
-
68
-
69
-
70
-
71
-
72
-
73
-
74
-
75
-
76
-
77
-
78
-
79
-
80
-
81
-
82
-
83
-
84
-
85
-
86
-
87
-
88
-
89
-
90
-
91
-
92
-
93
-
94
-
95
-
96
-
97
-
98
-
99
-
100
-
101
-
102
-
103
-
104
-
105
-
106
-
107
-
108
-
109
-
110
-
111
-
112
-
113
-
114
-
115
-
116
-
117
-
118
-
119
-
120
-
121
-
122
-
123
-
124
-
125
-
 126
126 -
 127
127 -
 128
128 -
 129
129 -
 130
130 -
 131
131 -
 132
132 -
 133
133 -
 134
134 -
 135
135 -
 136
136 -
 137
137 -
 138
138 -
 139
139 -
 140
140 -
 141
141 -
 142
142 -
 143
143 -
 144
144 -
 145
145 -
 146
146 -
147
-
148
-
149
-
150
-
151
-
152
-
153
-
154
-
155
-
156
-
157
-
158
-
159
-
160
-
161
-
162
-
163
-
164
-
165
-
166
-
167
-
168
-
169
-
170
-
171
-
172
-
173
-
174
-
175
-
176
-
177
-
178
-
179
-
180
-
181
-
182
 |
 |

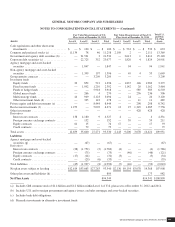
GENERAL MOTORS COMPANY AND SUBSIDIARIES
NOTES TO CONSOLIDATED FINANCIAL STATEMENTS — (Continued)
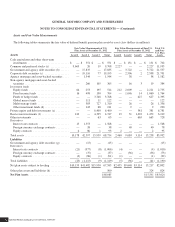
Fair Value Measurements of U.S.
Plan Assets at December 31, 2011
Fair Value Measurements of Non-U.S.
Plan Assets at December 31, 2011
Total U.S.
and Non-
U.S. Plan
AssetsAssets Level 1 Level 2 Level 3 Total Level 1 Level 2 Level 3 Total
Cash equivalents and other short-term
investments ........................... $ — $ 100 $ — $ 100 $ — $ 533 $ — $ 533 $ 633
Common and preferred stocks (a) ........... 11,134 78 46 11,258 2,109 2 — 2,111 13,369
Government and agency debt securities (b) .... — 21,531 3 21,534 — 3,613 1 3,614 25,148
Corporate debt securities (c) ................ — 22,725 352 23,077 — 1,820 4 1,824 24,901
Agency mortgage and asset-backed
securities ............................. — 1,847 — 1,847 — 94 — 94 1,941
Non-agency mortgage and asset-backed
securities ............................. — 1,399 197 1,596 — 49 4 53 1,649
Group annuity contracts ................... — — 3,209 3,209——— —3,209
Investment funds
Equity funds .......................... 23 852 521 1,396 — 1,837 146 1,983 3,379
Fixed income funds .................... — 1,092 1,210 2,302 — 1,142 20 1,162 3,464
Funds of hedge funds ................... — — 5,918 5,918 — — 585 585 6,503
Global macro funds .................... — 266 4 270 — — 236 236 506
Multi-strategy funds .................... 24 949 2,123 3,096 — 24 — 24 3,120
Other investment funds (d) ............... — 335 143 478 — — 11 11 489
Private equity and debt investments (e) ....... — — 8,444 8,444 — — 298 298 8,742
Real estate investments (f) ................. 1,279 — 5,092 6,371 13 27 1,345 1,385 7,756
Other investments ........................ — — — — — — 428 428 428
Derivatives
Interest rate contracts ................... 138 4,180 9 4,327 4 — — 4 4,331
Foreign currency exchange contracts . . . . . . . — 152 — 152 — 59 — 59 211
Equity contracts ....................... 61 15 — 76 17 — — 17 93
Credit contracts ........................ — 79 — 79——— — 79
Total assets ............................. 12,659 55,600 27,271 95,530 2,143 9,200 3,078 14,421 109,951
Liabilities
Agency mortgage and asset-backed
securities (g) .......................... — (67) — (67) — — — — (67)
Derivatives
Interest rate contracts ................... (28) (1,752) (2) (1,782) (4) — — (4) (1,786)
Foreign currency exchange contracts ....... — (75) — (75) — (46) — (46) (121)
Equity contracts ....................... (17) (14) — (31) (3) — — (3) (34)
Credit contracts ........................ — (29) (6) (35) — — — — (35)
Total liabilities .......................... (45) (1,937) (8) (1,990) (7) (46) — (53) (2,043)
Net plan assets subject to leveling ........... $12,614 $53,663 $27,263 93,540 $2,136 $9,154 $3,078 14,368 107,908
Other plan assets and liabilities (h) ........... 809 173 982
Net Plan Assets ......................... $94,349 $14,541 $108,890
(a) Includes GM common stock of $1.4 billion and $1.2 billion within Level 1 of U.S. plan assets at December 31, 2012 and 2011.
(b) Includes U.S. and sovereign government and agency issues; excludes mortgage and asset-backed securities.
(c) Includes bank debt obligations.
(d) Primarily investments in alternative investment funds.
General Motors Company 2012 ANNUAL REPORT 133