General Motors 2012 Annual Report Download - page 43
Download and view the complete annual report
Please find page 43 of the 2012 General Motors annual report below. You can navigate through the pages in the report by either clicking on the pages listed below, or by using the keyword search tool below to find specific information within the annual report.-
 1
1 -
2
-
3
-
4
-
5
-
6
-
7
-
8
-
9
-
10
-
11
-
12
-
13
-
14
-
15
-
16
-
17
-
18
-
19
-
20
-
21
-
22
-
23
-
24
-
25
-
26
-
27
-
28
-
29
-
30
-
31
-
32
-
 33
33 -
 34
34 -
 35
35 -
 36
36 -
 37
37 -
 38
38 -
 39
39 -
 40
40 -
 41
41 -
 42
42 -
 43
43 -
 44
44 -
 45
45 -
 46
46 -
 47
47 -
 48
48 -
 49
49 -
 50
50 -
 51
51 -
 52
52 -
 53
53 -
54
-
55
-
56
-
57
-
58
-
59
-
60
-
61
-
62
-
63
-
64
-
65
-
66
-
67
-
68
-
69
-
70
-
71
-
72
-
73
-
74
-
75
-
76
-
77
-
78
-
79
-
80
-
81
-
82
-
83
-
84
-
85
-
86
-
87
-
88
-
89
-
90
-
91
-
92
-
93
-
94
-
95
-
96
-
97
-
98
-
99
-
100
-
101
-
102
-
103
-
104
-
105
-
106
-
107
-
108
-
109
-
110
-
111
-
112
-
113
-
114
-
115
-
116
-
117
-
118
-
119
-
120
-
121
-
122
-
123
-
124
-
125
-
126
-
127
-
128
-
129
-
130
-
131
-
132
-
133
-
134
-
135
-
136
-
137
-
138
-
139
-
140
-
141
-
142
-
143
-
144
-
145
-
146
-
147
-
148
-
149
-
150
-
151
-
152
-
153
-
154
-
155
-
156
-
157
-
158
-
159
-
160
-
161
-
162
-
163
-
164
-
165
-
166
-
167
-
168
-
169
-
170
-
171
-
172
-
173
-
174
-
175
-
176
-
177
-
178
-
179
-
180
-
181
-
182
 |
 |

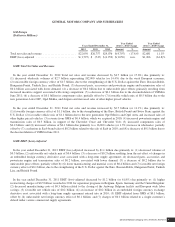
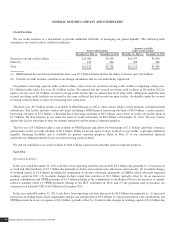
GENERAL MOTORS COMPANY AND SUBSIDIARIES
GM Financial
(Dollars in Millions)
Years Ended December 31,
Three Months
Ended
December 31,
2010
Year Ended
2012 vs. 2011 Change
2012 2011 Amount %
Total revenue .......................................... $1,961 $1,410 $281 $551 39.1%
Income before income taxes .............................. $ 744 $ 622 $129 $122 19.6%
GM Financial Revenue
In the year ended December 31, 2012 Total revenue increased by $0.6 billion (or 39.1%) due primarily to: (1) increased finance
charge income of $0.3 billion, due to a larger portfolio; and (2) increased leased vehicles income of $0.2 billion due to the increased
size of the leased asset portfolio.
In the year ended December 31, 2011 Total revenue included finance charge income of $1.2 billion and other income of $0.2
billion.
In the three months ended December 31, 2010 Total revenue included finance charge income of $0.3 billion. The effective yield on
GM Financial’s finance receivables was 12.1% for the three months ended December 31, 2010.
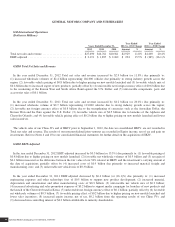
GM Financial Income Before Income Taxes
In the year ended December 31, 2012 Income before income taxes increased by $0.1 billion (or 19.6%) due primarily to:
(1) increased revenue of $0.6 billion; partially offset by (2) increased leased vehicle expenses of $0.1 billion due to a larger lease
portfolio; (3) increased provision for loan losses of $0.1 billion due to a larger loan portfolio; (4) increased interest expenses of $0.1
billion primarily due to new debt; and (5) increased operating expenses of $0.1 billion due to an increase of personnel to support
company growth.
Average debt outstanding in the year ended December 31, 2012 was $9.5 billion and the effective rate of interest of debt was 3.0%.
In the year ended December 31, 2011 results included: (1) Total revenue of $1.4 billion; partially offset by (2) operating and leased
vehicle expenses of $0.4 billion; (3) interest expense of $0.2 billion; and (4) provision for loan losses of $0.2 billion. GM Financial’s
operating expenses are primarily related to personnel costs that include base salary and wages, performance incentives and benefits as
well as related employment taxes. Provisions for loan losses are charged to income to bring the allowance for loan losses to a level
which management considers adequate to absorb probable credit losses inherent in the portfolio of finance receivables originated
since October 1, 2010. Interest expense represents interest paid on GM Financial’s warehouse credit facilities, securitization notes
payable, and other unsecured debt.
Average debt outstanding in the year ended December 31, 2011 was $7.6 billion and the effective rate of interest of debt was 2.7%.
In the three months ended December 31, 2010 results included: (1) Total revenue of $0.3 billion; partially offset by (2) operating
and leased vehicle expenses of $0.1 billion; and; (3) other collectively insignificant items.
Average debt outstanding in the three months ended December 31, 2010 was $7.3 billion and the effective rate of interest debt was
2.0%.
General Motors Company 2012 ANNUAL REPORT40