General Motors 2012 Annual Report Download - page 174
Download and view the complete annual report
Please find page 174 of the 2012 General Motors annual report below. You can navigate through the pages in the report by either clicking on the pages listed below, or by using the keyword search tool below to find specific information within the annual report.-
 1
1 -
2
-
3
-
4
-
5
-
6
-
7
-
8
-
9
-
10
-
11
-
12
-
13
-
14
-
15
-
16
-
17
-
18
-
19
-
20
-
21
-
22
-
23
-
24
-
25
-
26
-
27
-
28
-
29
-
30
-
31
-
32
-
33
-
34
-
35
-
36
-
37
-
38
-
39
-
40
-
41
-
42
-
43
-
44
-
45
-
46
-
47
-
48
-
49
-
50
-
51
-
52
-
53
-
54
-
55
-
56
-
57
-
58
-
59
-
60
-
61
-
62
-
63
-
64
-
65
-
66
-
67
-
68
-
69
-
70
-
71
-
72
-
73
-
74
-
75
-
76
-
77
-
78
-
79
-
80
-
81
-
82
-
83
-
84
-
85
-
86
-
87
-
88
-
89
-
90
-
91
-
92
-
93
-
94
-
95
-
96
-
97
-
98
-
99
-
100
-
101
-
102
-
103
-
104
-
105
-
106
-
107
-
108
-
109
-
110
-
111
-
112
-
113
-
114
-
115
-
116
-
117
-
118
-
119
-
120
-
121
-
122
-
123
-
124
-
125
-
126
-
127
-
128
-
129
-
130
-
131
-
132
-
133
-
134
-
135
-
136
-
137
-
138
-
139
-
140
-
141
-
142
-
143
-
144
-
145
-
146
-
147
-
148
-
149
-
150
-
151
-
152
-
153
-
154
-
155
-
156
-
157
-
158
-
159
-
160
-
161
-
162
-
163
-
 164
164 -
 165
165 -
 166
166 -
 167
167 -
 168
168 -
 169
169 -
 170
170 -
 171
171 -
 172
172 -
 173
173 -
 174
174 -
 175
175 -
 176
176 -
 177
177 -
 178
178 -
 179
179 -
 180
180 -
 181
181 -
 182
182
 |
 |

GENERAL MOTORS COMPANY AND SUBSIDIARIES
NOTES TO CONSOLIDATED FINANCIAL STATEMENTS — (Continued)
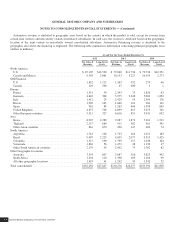
The following tables summarize key financial information by segment (dollars in millions):
At and For the Year Ended December 31, 2012
GMNA GME GMIO GMSA Corporate Eliminations
Total
Automotive
GM
Financial Eliminations Total
Sales
External customers ........... $89,912 $20,689 $22,954 $16,700 $ 40 $ — $150,295 $ — $ — $150,295
GM Financial revenue ......... ———— — — —1,961 — 1,961
Intersegment ................ 4,683 1,361 4,736 250 — (11,032) (2) — 2 —
Total net sales and revenue ....... $94,595 $22,050 $27,690 $16,950 $ 40 $(11,032) $150,293 $ 1,961 $ 2 $152,256
Income (loss) before automotive
interest and income taxes-
adjusted .................... $ 6,953 $ (1,797) $ 2,191 $ 271 $ (395) $ (107) $ 7,116 $ 744 $ (1) $ 7,859
Adjustments (a) ................ $(29,052) $ (6,391) $ (288) $ 27 (402) $ — $ (36,106) — $ — (36,106)
Corporate interest income ........ 343 343
Automotive interest expense ...... 489 489
Loss on extinguishment of debt . . . . 250 — 250
Income (loss) before income
taxes ....................... (1,193) 744 (28,643)
Income tax expense (benefit) ...... (35,007) 177 $ (1) (34,831)
Net income attributable to
stockholders ................. $ 33,814 $ 567 $ 6,188
Equity in net assets of
nonconsolidated affiliates ...... $ 65 $ 51 $ 6,764 $ 3 $ — $ — $ 6,883 $ — $ — $ 6,883
Total assets ................... $87,181 $ 9,781 $25,092 $12,070 $ 16,991 $(17,371) $133,744 $16,368 $(690) $149,422
Expenditures for property ........ $ 4,766 $ 1,035 $ 1,225 $ 956 $ 77 $ (4) $ 8,055 $ 13 $ — $ 8,068
Depreciation, amortization and
impairment of long-lived assets
and finite-lived intangible
assets ...................... $ 3,663 $ 6,570 $ 638 $ 483 $ 49 $ (1) $ 11,402 $ 225 $ (10) $ 11,617
Equity income, net of tax and gain
on investments ............... $ 9 $ — $ 1,552 $ 1 $ — $ — $ 1,562 $ — $ — $ 1,562
Significant non-cash charges
(benefits) not classified as
adjustments in (a) ............
Impairment charges related to
long-lived assets ........... $ 50 $ — $ 28 $ 2 $ — $ — $ 80 $ — $ — $ 80
Impairment charges related to
equipment on operating
leases .................... 40 141 — — — — 181 — — 181
Valuation allowances against
deferred tax assets(b) ........ ————(36,261) — (36,261) (103) — (36,364)
Total significant non-cash charges
(benefits) ................... $ 90 $ 141 $ 28 $ 2 $(36,261) $ — $ (36,000) $ (103) $ — $ (36,103)
(a) Consists of Goodwill impairment charges of $26.4 billion, pension settlement charges of $2.7 billion and income related to various insurance recoveries of $9
million in GMNA; property impairment charges of $3.7 billion, intangible assets impairment charges of $1.8 billion, goodwill impairment charges of $590 million,
impairment charges related to investment in PSA of $220 million, a charge of $119 million to record GMS assets and liabilities to estimated fair value and income
related to various insurance recoveries of $7 million in GME; GM Korea hourly wage litigation charge of $336 million, goodwill impairment charges of $132
million, which are presented net of noncontrolling interests, income related to various insurance recoveries of $112 million and income related to redemption of the
GM Korea mandatorily redeemable preferred shares of $68 million in GMIO; income related to various insurance recoveries of $27 million in GMSA; and a
charge of $402 million which represents the premium paid to purchase our common stock from the UST in Corporate.
(b) Includes valuation allowance releases of $36.5 billion net of the establishment of new valuation allowances of $0.1 billion. Amounts exclude changes related to
income tax expense (benefits) in jurisdictions with a full valuation allowance throughout the period.
General Motors Company 2012 ANNUAL REPORT 171