General Motors 2012 Annual Report Download - page 142
Download and view the complete annual report
Please find page 142 of the 2012 General Motors annual report below. You can navigate through the pages in the report by either clicking on the pages listed below, or by using the keyword search tool below to find specific information within the annual report.-
 1
1 -
2
-
3
-
4
-
5
-
6
-
7
-
8
-
9
-
10
-
11
-
12
-
13
-
14
-
15
-
16
-
17
-
18
-
19
-
20
-
21
-
22
-
23
-
24
-
25
-
26
-
27
-
28
-
29
-
30
-
31
-
32
-
33
-
34
-
35
-
36
-
37
-
38
-
39
-
40
-
41
-
42
-
43
-
44
-
45
-
46
-
47
-
48
-
49
-
50
-
51
-
52
-
53
-
54
-
55
-
56
-
57
-
58
-
59
-
60
-
61
-
62
-
63
-
64
-
65
-
66
-
67
-
68
-
69
-
70
-
71
-
72
-
73
-
74
-
75
-
76
-
77
-
78
-
79
-
80
-
81
-
82
-
83
-
84
-
85
-
86
-
87
-
88
-
89
-
90
-
91
-
92
-
93
-
94
-
95
-
96
-
97
-
98
-
99
-
100
-
101
-
102
-
103
-
104
-
105
-
106
-
107
-
108
-
109
-
110
-
111
-
112
-
113
-
114
-
115
-
116
-
117
-
118
-
119
-
120
-
121
-
122
-
123
-
124
-
125
-
126
-
127
-
128
-
129
-
130
-
131
-
 132
132 -
 133
133 -
 134
134 -
 135
135 -
 136
136 -
 137
137 -
 138
138 -
 139
139 -
 140
140 -
 141
141 -
 142
142 -
 143
143 -
 144
144 -
 145
145 -
 146
146 -
 147
147 -
 148
148 -
 149
149 -
 150
150 -
 151
151 -
 152
152 -
153
-
154
-
155
-
156
-
157
-
158
-
159
-
160
-
161
-
162
-
163
-
164
-
165
-
166
-
167
-
168
-
169
-
170
-
171
-
172
-
173
-
174
-
175
-
176
-
177
-
178
-
179
-
180
-
181
-
182
 |
 |

GENERAL MOTORS COMPANY AND SUBSIDIARIES
NOTES TO CONSOLIDATED FINANCIAL STATEMENTS — (Continued)
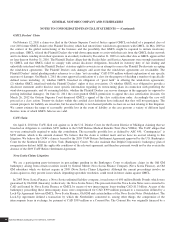
Benefit Payments
The following table summarizes net benefit payments expected to be paid in the future, which include assumptions related to
estimated future employee service (dollars in millions):
Pension Benefits (a) Other Benefits
U.S. Plans Non-U.S. Plans U.S. Plans Non-U.S. Plans
2013 ............................................................ $ 6,052 $1,491 $ 421 $ 63
2014 ............................................................ $ 5,912 $1,507 $ 373 $ 65
2015 ............................................................ $ 5,861 $1,546 $ 366 $ 67
2016 ............................................................ $ 5,674 $1,575 $ 360 $ 70
2017 ............................................................ $ 5,558 $1,588 $ 356 $ 72
2018-2022 ........................................................ $25,259 $8,092 $1,713 $391
(a) Benefits for most U.S. pension plans and certain non-U.S. pension plans are paid out of plan assets rather than our Cash and cash
equivalents.
Note 19. Derivative Financial Instruments and Risk Management
Automotive
Derivatives and Hedge Accounting
In accordance with our risk management policy, we enter into a variety of foreign currency exchange rate and commodity
derivative contracts to manage our exposure to fluctuations in certain foreign currency exchange rates and commodity prices. At
December 31, 2012 and 2011 our derivative instruments consisted primarily of forward contracts and options, none of which were
designated in hedging relationships. We manage our counterparty credit risk by monitoring the credit ratings of our counterparties and
by requiring them to post collateral in certain circumstances. Agreements are entered into with counterparties that allow the set-off of
certain exposures in order to manage the risk. Certain of our agreements with counterparties require that we provide cash collateral. At
December 31, 2012 and 2011 no collateral was posted related to derivative instruments and we did not have any agreements with
counterparties to derivative instruments containing covenants requiring the maintenance of certain credit rating levels or credit risk
ratios that would require the posting of collateral in the event that such covenants are violated.
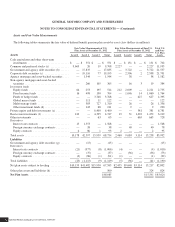
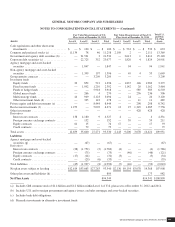
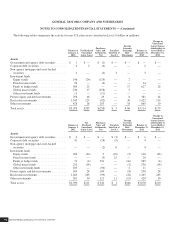
Fair Value of Derivatives
The following tables summarize fair value measurements of our derivative instruments measured on a recurring basis (dollars in
millions):
December 31, 2012
Derivative Assets Derivative Liabilities
Notional Current (a) Non-Current (b) Current (c) Non-Current (d)
Foreign currency ....................................... $ 7,652 $118 $— $19 $—
Commodity ........................................... 1,851 17 3 7 —
Embedded ............................................ 1,248 9 19 — 1
Total ................................................ $10,751 $144 $22 $26 $ 1
General Motors Company 2012 ANNUAL REPORT 139