General Motors 2012 Annual Report Download - page 29
Download and view the complete annual report
Please find page 29 of the 2012 General Motors annual report below. You can navigate through the pages in the report by either clicking on the pages listed below, or by using the keyword search tool below to find specific information within the annual report.-
 1
1 -
2
-
3
-
4
-
5
-
6
-
7
-
8
-
9
-
10
-
11
-
12
-
13
-
14
-
15
-
16
-
17
-
18
-
 19
19 -
 20
20 -
 21
21 -
 22
22 -
 23
23 -
 24
24 -
 25
25 -
 26
26 -
 27
27 -
 28
28 -
 29
29 -
 30
30 -
 31
31 -
 32
32 -
 33
33 -
 34
34 -
 35
35 -
 36
36 -
 37
37 -
 38
38 -
 39
39 -
40
-
41
-
42
-
43
-
44
-
45
-
46
-
47
-
48
-
49
-
50
-
51
-
52
-
53
-
54
-
55
-
56
-
57
-
58
-
59
-
60
-
61
-
62
-
63
-
64
-
65
-
66
-
67
-
68
-
69
-
70
-
71
-
72
-
73
-
74
-
75
-
76
-
77
-
78
-
79
-
80
-
81
-
82
-
83
-
84
-
85
-
86
-
87
-
88
-
89
-
90
-
91
-
92
-
93
-
94
-
95
-
96
-
97
-
98
-
99
-
100
-
101
-
102
-
103
-
104
-
105
-
106
-
107
-
108
-
109
-
110
-
111
-
112
-
113
-
114
-
115
-
116
-
117
-
118
-
119
-
120
-
121
-
122
-
123
-
124
-
125
-
126
-
127
-
128
-
129
-
130
-
131
-
132
-
133
-
134
-
135
-
136
-
137
-
138
-
139
-
140
-
141
-
142
-
143
-
144
-
145
-
146
-
147
-
148
-
149
-
150
-
151
-
152
-
153
-
154
-
155
-
156
-
157
-
158
-
159
-
160
-
161
-
162
-
163
-
164
-
165
-
166
-
167
-
168
-
169
-
170
-
171
-
172
-
173
-
174
-
175
-
176
-
177
-
178
-
179
-
180
-
181
-
182
 |
 |

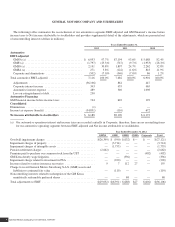
GENERAL MOTORS COMPANY AND SUBSIDIARIES
Consolidating Results of Operations
(Dollars in Millions)
Year Ended December 31, 2012 Year Ended December 31, 2011 Year Ended December 31, 2010
Automotive
GM
Financial Eliminations Consolidated Automotive
GM
Financial Eliminations Consolidated Automotive
GM
Financial Eliminations Consolidated
Net sales and revenue
Automotive sales and
revenue .............. $150,293 $ — $ 2 $150,295 $148,869 $ — $ (3) $148,866 $135,311 $ — $— $135,311
GM Financial revenue .... — 1,961 — 1,961 — 1,410 — 1,410 — 281 — 281
Total net sales and
revenue .............. 150,293 1,961 2 152,256 148,869 1,410 (3) 150,276 135,311 281 — 135,592
Costs and expenses
Automotive cost of sales . . 140,223 — 13 140,236 130,386 — — 130,386 118,768 — — 118,768
GM Financial operating
expenses ............. — 418 — 418 — 339 — 339 — 87 — 87
GM Financial interest
expenses ............. — 283 — 283 — 204 — 204 — 37 — 37
GM Financial other
expenses ............. — 516 (10) 506 — 245 (3) 242 — 28 — 28
Automotive selling, general
and administrative
expense .............. 13,593 — — 13,593 12,105 — — 12,105 11,446 — — 11,446
Other automotive expenses,
net.................. 438 — — 438 58 — — 58 118 — — 118
Goodwill impairment
charges .............. 27,145 — — 27,145 1,286 — — 1,286 — — — —
Total costs and expenses . . 181,399 1,217 3 182,619 143,835 788 (3) 144,620 130,332 152 — 130,484
Operating income (loss) . . . (31,106) 744 (1) (30,363) 5,034 622 — 5,656 4,979 129 — 5,108
Automotive interest
expense ................ 489 — — 489 540 — — 540 1,098 — — 1,098
Interest income and other non-
operating income, net . . . . . 845 — — 845 851 — — 851 1,531 — — 1,531
Gains (losses) on
extinguishment of debt .... (250) — — (250) 18 — — 18 196 — — 196
Income (loss) before income
taxes and equity income . . . (31,000) 744 (1) (30,257) 5,363 622 — 5,985 5,608 129 — 5,737
Income tax expense
(benefit) ............... (35,007) 177 (1) (34,831) (295) 185 — (110) 633 39 — 672
Equity income, net of tax and
gain on investments ...... 1,562 — — 1,562 3,192 — — 3,192 1,438 — — 1,438
Net income ............... 5,569 567 — 6,136 8,850 437 — 9,287 6,413 90 — 6,503
Net (income) loss attributable
to noncontrolling
interests ............... 52 — — 52 (97) — — (97) (331) — — (331)
Net income attributable to
stockholders ........... $ 5,621 $ 567 $ — $ 6,188 $ 8,753 $ 437 $— $ 9,190 $ 6,082 $ 90 $— $ 6,172
Production and Vehicle Sales Volume
Management believes that production volume and vehicle sales data provide meaningful information regarding our automotive
operating results. Production volumes manufactured by our assembly facilities are generally aligned with current period net sales and
revenue, as we generally recognize revenue upon the release of the vehicle to the carrier responsible for transporting it to a dealer,
which is shortly after the completion of production. Vehicle sales data, which includes retail and fleet sales, does not correlate directly
to the revenue we recognize during the period. However, vehicle sales data is indicative of the underlying demand for our vehicles,
and is the basis for our market share.
General Motors Company 2012 ANNUAL REPORT26