General Motors 2012 Annual Report Download - page 32
Download and view the complete annual report
Please find page 32 of the 2012 General Motors annual report below. You can navigate through the pages in the report by either clicking on the pages listed below, or by using the keyword search tool below to find specific information within the annual report.-
 1
1 -
2
-
3
-
4
-
5
-
6
-
7
-
8
-
9
-
10
-
11
-
12
-
13
-
14
-
15
-
16
-
17
-
18
-
19
-
20
-
21
-
 22
22 -
 23
23 -
 24
24 -
 25
25 -
 26
26 -
 27
27 -
 28
28 -
 29
29 -
 30
30 -
 31
31 -
 32
32 -
 33
33 -
 34
34 -
 35
35 -
 36
36 -
 37
37 -
 38
38 -
 39
39 -
 40
40 -
 41
41 -
 42
42 -
43
-
44
-
45
-
46
-
47
-
48
-
49
-
50
-
51
-
52
-
53
-
54
-
55
-
56
-
57
-
58
-
59
-
60
-
61
-
62
-
63
-
64
-
65
-
66
-
67
-
68
-
69
-
70
-
71
-
72
-
73
-
74
-
75
-
76
-
77
-
78
-
79
-
80
-
81
-
82
-
83
-
84
-
85
-
86
-
87
-
88
-
89
-
90
-
91
-
92
-
93
-
94
-
95
-
96
-
97
-
98
-
99
-
100
-
101
-
102
-
103
-
104
-
105
-
106
-
107
-
108
-
109
-
110
-
111
-
112
-
113
-
114
-
115
-
116
-
117
-
118
-
119
-
120
-
121
-
122
-
123
-
124
-
125
-
126
-
127
-
128
-
129
-
130
-
131
-
132
-
133
-
134
-
135
-
136
-
137
-
138
-
139
-
140
-
141
-
142
-
143
-
144
-
145
-
146
-
147
-
148
-
149
-
150
-
151
-
152
-
153
-
154
-
155
-
156
-
157
-
158
-
159
-
160
-
161
-
162
-
163
-
164
-
165
-
166
-
167
-
168
-
169
-
170
-
171
-
172
-
173
-
174
-
175
-
176
-
177
-
178
-
179
-
180
-
181
-
182
 |
 |

GENERAL MOTORS COMPANY AND SUBSIDIARIES
Year Ended December 31, 2011
GMNA GME GMIO GMSA Corporate Total
Gain on sale of our New Delphi Class A Membership Interests ........... $1,645 $ — $ — $— $ — $ 1,645
Goodwill impairment charges ..................................... — (1,016) (258) — — (1,274)
Gain related to HCT settlement .................................... 749 — — — — 749
Impairment related to Ally Financial common stock ................... — — — — (555) (555)
Gain on sale of Ally Financial preferred stock ........................ — — — — 339 339
Charges related to HKJV ......................................... — — (106) — — (106)
Gain on extinguishment of debt .................................... — — — 63 — 63
Total adjustments to EBIT ........................................ $2,394 $(1,016) $(364) $63 $(216) $ 861
Year Ended December 31, 2010
GMNA GME GMIO GMSA Corporate Total
Gain on extinguishment of VEBA Note ............................. $ — $ — $ — $— $198 $ 198
Gain on sale of Saab ............................................. — 123 — — — 123
Gain on acquisition of GMS ...................................... — 66 — — — 66
Gain on sale of Nexteer Automotive Corporation (Nexteer) .............. 60 — — — — 60
Total adjustments to EBIT ........................................ $ 60 $ 189 $ — $— $198 $ 447
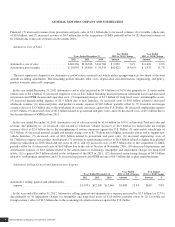
Total Net Sales and Revenue
(Dollars in Millions)
Years Ended December 31,
Year Ended
2012 vs. 2011 Change
Year Ended
2011 vs. 2010 Change
2012 2011 2010 Amount % Amount %
GMNA ............................... $ 94,595 $ 90,233 $ 83,035 $ 4,362 4.8% $ 7,198 8.7%
GME ................................ 22,050 26,757 24,076 (4,707) (17.6)% 2,681 11.1%
GMIO ............................... 27,690 24,761 20,561 2,929 11.8% 4,200 20.4%
GMSA ............................... 16,950 16,877 15,379 73 0.4% 1,498 9.7%
GM Financial ......................... 1,961 1,410 281 551 39.1% 1,129 n.m.
Total operating segments ................ 163,246 160,038 143,332 3,208 2.0% 16,706 11.7%
Corporate and eliminations ............... (10,990) (9,762) (7,740) (1,228) (12.6)% (2,022) 26.1%
Total net sales and revenue ............... $152,256 $150,276 $135,592 $ 1,980 1.3% $14,684 10.8%
n.m. = not meaningful
In the year ended December 31, 2012 Total net sales and revenue increased by $2.0 billion (or 1.3%) due primarily to: (1) favorable
vehicle mix of $3.7 billion; (2) favorable vehicle pricing effect of $1.6 billion; (3) increased wholesale volumes of $1.5 billion;
(4) increased GM Financial finance income of $0.6 billion; partially offset by (5) unfavorable net foreign currency effect of
$3.7 billion due to the weakening of certain currencies against the U.S. Dollar; (6) decreased revenues from powertrain and parts sales
of $0.7 billion due to decreased volumes; (7) reduction in favorable lease residual adjustments of $0.5 billion; (8) decreased revenues
from rental car leases of $0.2 billion; and (9) decreased revenues due to the deconsolidation of VM Motori (VMM) in June 2011 of
$0.1 billion.
In the year ended December 31, 2011 Total net sales and revenue increased by $14.7 billion (or 10.8%) due primarily to:
(1) increased wholesale volumes of $8.6 billion representing 403,000 vehicles; (2) favorable net foreign currency effect of $2.6 billion
due to the strengthening of certain currencies against the U.S. Dollar; (3) favorable vehicle pricing effect of $1.6 billion due to model
year price increases and reduced sales allowances; (4) increased finance income of $1.1 billion due to the acquisition of GM
General Motors Company 2012 ANNUAL REPORT 29