General Motors 2012 Annual Report Download - page 44
Download and view the complete annual report
Please find page 44 of the 2012 General Motors annual report below. You can navigate through the pages in the report by either clicking on the pages listed below, or by using the keyword search tool below to find specific information within the annual report.-
 1
1 -
2
-
3
-
4
-
5
-
6
-
7
-
8
-
9
-
10
-
11
-
12
-
13
-
14
-
15
-
16
-
17
-
18
-
19
-
20
-
21
-
22
-
23
-
24
-
25
-
26
-
27
-
28
-
29
-
30
-
31
-
32
-
33
-
 34
34 -
 35
35 -
 36
36 -
 37
37 -
 38
38 -
 39
39 -
 40
40 -
 41
41 -
 42
42 -
 43
43 -
 44
44 -
 45
45 -
 46
46 -
 47
47 -
 48
48 -
 49
49 -
 50
50 -
 51
51 -
 52
52 -
 53
53 -
 54
54 -
55
-
56
-
57
-
58
-
59
-
60
-
61
-
62
-
63
-
64
-
65
-
66
-
67
-
68
-
69
-
70
-
71
-
72
-
73
-
74
-
75
-
76
-
77
-
78
-
79
-
80
-
81
-
82
-
83
-
84
-
85
-
86
-
87
-
88
-
89
-
90
-
91
-
92
-
93
-
94
-
95
-
96
-
97
-
98
-
99
-
100
-
101
-
102
-
103
-
104
-
105
-
106
-
107
-
108
-
109
-
110
-
111
-
112
-
113
-
114
-
115
-
116
-
117
-
118
-
119
-
120
-
121
-
122
-
123
-
124
-
125
-
126
-
127
-
128
-
129
-
130
-
131
-
132
-
133
-
134
-
135
-
136
-
137
-
138
-
139
-
140
-
141
-
142
-
143
-
144
-
145
-
146
-
147
-
148
-
149
-
150
-
151
-
152
-
153
-
154
-
155
-
156
-
157
-
158
-
159
-
160
-
161
-
162
-
163
-
164
-
165
-
166
-
167
-
168
-
169
-
170
-
171
-
172
-
173
-
174
-
175
-
176
-
177
-
178
-
179
-
180
-
181
-
182
 |
 |

GENERAL MOTORS COMPANY AND SUBSIDIARIES
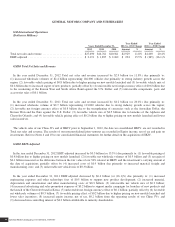
Corporate
(Dollars in Millions)
Years Ended December 31,
Year Ended
2012 vs. 2011 Change
Year Ended
2011 vs. 2010 Change
2012 2011 2010 Amount % Amount %
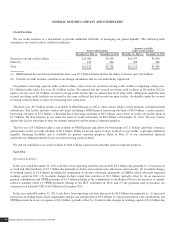
Total net sales and revenue ............................. $ 40 $ 61 $134 $ (21) (34.4)% $ (73) (54.5)%
Net income (loss) attributable to stockholders .............. $33,814 $(453) $(877) $34,267 n.m. $424 (48.3)%
n.m. = not meaningful
Nonsegment operations are classified as Corporate. Corporate includes an investment in Ally Financial, certain centrally recorded
income and costs, such as interest, income taxes and corporate expenditures, and certain nonsegment specific revenues and expenses.
Corporate Total Net Sales and Revenue
Total net sales and revenue includes revenue earned for portfolio management services performed for third-parties and the change
in the year ended December 31, 2012 was insignificant.
In the year ended December 31, 2011 Total net sales and revenue decreased by $0.1 billion (or 54.5%) due primarily to decreased
revenue earned on portfolio management services performed for third-parties due to the planned reduction of third-party assets
managed and decreased lease financing revenues related to the liquidation of the portfolio of automotive retail leases. Average
outstanding retail leases on-hand decreased to a de minimus level at December 31, 2011 compared to 7,000 at December 31, 2010.
Corporate Net Income (Loss) Attributable to Stockholders
In the year ended December 31, 2012 Net income attributable to stockholders increased by $34.3 billion due primarily to:
(1) deferred tax asset valuation allowance reversals of $36.3 billion in the U.S and Canada in 2012 as compared to $0.5 billion in
Australia in 2011, offset by other 2012 tax-related matters of $0.9 billion; and (2) an impairment charge of $0.6 billion in our
investment in Ally Financial common stock in 2011; offset by (3) the premium paid to purchase our common stock from the UST of
$0.4 billion in December 2012; (4) a gain of $0.3 billion related to the sale of our Ally Financial preferred stock in 2011; and (5) loss
on extinguishment of debt in 2012 of $0.3 billion which primarily represented the unamortized debt discount on the GM Korea
mandatorily redeemable preferred shares.
In the year ended December 31, 2011 Net loss attributable to stockholders decreased by $0.4 billion (or 48.3%) due primarily to:
(1) an income tax benefit of $0.3 billion compared to income tax expense of $0.6 billion in 2010; (2) decreased interest expense of
$0.6 billion due to lower debt balances; and (3) a gain of $0.3 billion related to the sale of our Ally Financial preferred stock; offset by
(4) an impairment charge of $0.6 billion on our investment in Ally Financial common stock; (5) gains on the extinguishment of debt
of $0.2 billion related to the repayment of the VEBA Notes and the elimination of the liability for the Adjustment Shares of
$0.2 billion in 2010; and (6) other collectively insignificant items.
Liquidity and Capital Resources
Liquidity Overview
We believe that our current level of cash and cash equivalents, marketable securities and availability under our secured revolving
credit facilities will be sufficient to meet our liquidity needs. However, we expect to have substantial cash requirements going forward
which we plan to fund through total available liquidity and cash flows generated from operations. Our known material future uses of
cash which may vary from time to time based on market conditions and other factors include, among other possible demands in 2013:
(1) reinvestment in our business through capital expenditures of approximately $8 billion as well as engineering and product
General Motors Company 2012 ANNUAL REPORT 41