General Motors 2012 Annual Report Download - page 55
Download and view the complete annual report
Please find page 55 of the 2012 General Motors annual report below. You can navigate through the pages in the report by either clicking on the pages listed below, or by using the keyword search tool below to find specific information within the annual report.-
 1
1 -
2
-
3
-
4
-
5
-
6
-
7
-
8
-
9
-
10
-
11
-
12
-
13
-
14
-
15
-
16
-
17
-
18
-
19
-
20
-
21
-
22
-
23
-
24
-
25
-
26
-
27
-
28
-
29
-
30
-
31
-
32
-
33
-
34
-
35
-
36
-
37
-
38
-
39
-
40
-
41
-
42
-
43
-
44
-
 45
45 -
 46
46 -
 47
47 -
 48
48 -
 49
49 -
 50
50 -
 51
51 -
 52
52 -
 53
53 -
 54
54 -
 55
55 -
 56
56 -
 57
57 -
 58
58 -
 59
59 -
 60
60 -
 61
61 -
 62
62 -
 63
63 -
 64
64 -
 65
65 -
66
-
67
-
68
-
69
-
70
-
71
-
72
-
73
-
74
-
75
-
76
-
77
-
78
-
79
-
80
-
81
-
82
-
83
-
84
-
85
-
86
-
87
-
88
-
89
-
90
-
91
-
92
-
93
-
94
-
95
-
96
-
97
-
98
-
99
-
100
-
101
-
102
-
103
-
104
-
105
-
106
-
107
-
108
-
109
-
110
-
111
-
112
-
113
-
114
-
115
-
116
-
117
-
118
-
119
-
120
-
121
-
122
-
123
-
124
-
125
-
126
-
127
-
128
-
129
-
130
-
131
-
132
-
133
-
134
-
135
-
136
-
137
-
138
-
139
-
140
-
141
-
142
-
143
-
144
-
145
-
146
-
147
-
148
-
149
-
150
-
151
-
152
-
153
-
154
-
155
-
156
-
157
-
158
-
159
-
160
-
161
-
162
-
163
-
164
-
165
-
166
-
167
-
168
-
169
-
170
-
171
-
172
-
173
-
174
-
175
-
176
-
177
-
178
-
179
-
180
-
181
-
182
 |
 |

GENERAL MOTORS COMPANY AND SUBSIDIARIES
foreign currency translation effect of $0.3 billion; and (4) costs primarily related to plan amendments and other of $0.2 billion;
partially offset by (5) actual return on plan assets of $1.3 billion; and (6) contributions and benefit payments of $0.9 billion.
Hourly and salaried OPEB plans provide postretirement life insurance to most U.S. retirees and eligible dependents and
postretirement health coverage to some U.S. retirees and eligible dependents. Certain of the non-U.S. subsidiaries have postretirement
benefit plans, although most participants are covered by government sponsored or administered programs.
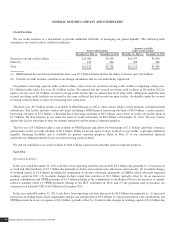
The following table summarizes the unfunded status of OPEB plans (dollars in billions):
December 31, 2012 December 31, 2011
U.S. OPEB plans ................................................................ $6.3 $5.8
Non-U.S. OPEB plans ............................................................ 1.5 1.5
Total unfunded ................................................................. $7.8 $7.3
Refer to Note 18 to our consolidated financial statements for the change in benefit obligations and related plan assets.
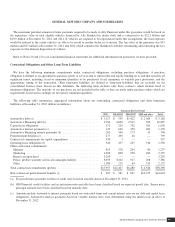
The following table summarizes net benefit payments expected to be paid in the future, which include assumptions related to
estimated future employee service (dollars in millions):
Pension Benefits (a) Other Benefits
U.S. Plans Non-U.S. Plans U.S. Plans Non-U.S. Plans
2013 ............................................................. $ 6,052 $1,491 $ 421 $ 63
2014 ............................................................. $ 5,912 $1,507 $ 373 $ 65
2015 ............................................................. $ 5,861 $1,546 $ 366 $ 67
2016 ............................................................. $ 5,674 $1,575 $ 360 $ 70
2017 ............................................................. $ 5,558 $1,588 $ 356 $ 72
2018-2022 ........................................................ $25,259 $8,092 $1,713 $391
(a) Benefits for most U.S. pension plans and certain non-U.S. pension plans are paid out of plan assets rather than our Cash and cash
equivalents.
Off-Balance Sheet Arrangements
We do not currently utilize off-balance sheet securitization arrangements. All trade or financing receivables and related obligations
subject to securitization programs are recorded on our consolidated balance sheets at December 31, 2012 and 2011.
Guarantees Provided to Third-Parties
We have provided guarantees related to the residual value of operating leases, certain suppliers’ commitments, certain product-
related claims and commercial loans made by Ally Financial and outstanding with certain third-parties excluding vehicle repurchase
obligations, residual support and risk sharing related to Ally Financial. The maximum potential obligation under these commitments
was $1.4 billion and $1.1 billion at December 31, 2012 and 2011.
Our current agreement with Ally Financial requires the repurchase of Ally Financial financed inventory invoiced to dealers with
limited exclusions, in the event of a qualifying voluntary or involuntary termination of the dealer’s sales and service agreement. The
repurchase obligation ended in August 2010 for vehicles invoiced through August 2009, ended in August 2011 for vehicles invoiced
through August 2010, ended in August 2012 for vehicles invoiced through August 2011, ends in August 2013 for vehicles invoiced
through August 2012 and ends in August 2014 for vehicles invoiced through August 2013.
General Motors Company 2012 ANNUAL REPORT52