General Motors 2012 Annual Report Download - page 133
Download and view the complete annual report
Please find page 133 of the 2012 General Motors annual report below. You can navigate through the pages in the report by either clicking on the pages listed below, or by using the keyword search tool below to find specific information within the annual report.-
 1
1 -
2
-
3
-
4
-
5
-
6
-
7
-
8
-
9
-
10
-
11
-
12
-
13
-
14
-
15
-
16
-
17
-
18
-
19
-
20
-
21
-
22
-
23
-
24
-
25
-
26
-
27
-
28
-
29
-
30
-
31
-
32
-
33
-
34
-
35
-
36
-
37
-
38
-
39
-
40
-
41
-
42
-
43
-
44
-
45
-
46
-
47
-
48
-
49
-
50
-
51
-
52
-
53
-
54
-
55
-
56
-
57
-
58
-
59
-
60
-
61
-
62
-
63
-
64
-
65
-
66
-
67
-
68
-
69
-
70
-
71
-
72
-
73
-
74
-
75
-
76
-
77
-
78
-
79
-
80
-
81
-
82
-
83
-
84
-
85
-
86
-
87
-
88
-
89
-
90
-
91
-
92
-
93
-
94
-
95
-
96
-
97
-
98
-
99
-
100
-
101
-
102
-
103
-
104
-
105
-
106
-
107
-
108
-
109
-
110
-
111
-
112
-
113
-
114
-
115
-
116
-
117
-
118
-
119
-
120
-
121
-
122
-
 123
123 -
 124
124 -
 125
125 -
 126
126 -
 127
127 -
 128
128 -
 129
129 -
 130
130 -
 131
131 -
 132
132 -
 133
133 -
 134
134 -
 135
135 -
 136
136 -
 137
137 -
 138
138 -
 139
139 -
 140
140 -
 141
141 -
 142
142 -
 143
143 -
144
-
145
-
146
-
147
-
148
-
149
-
150
-
151
-
152
-
153
-
154
-
155
-
156
-
157
-
158
-
159
-
160
-
161
-
162
-
163
-
164
-
165
-
166
-
167
-
168
-
169
-
170
-
171
-
172
-
173
-
174
-
175
-
176
-
177
-
178
-
179
-
180
-
181
-
182
 |
 |

GENERAL MOTORS COMPANY AND SUBSIDIARIES
NOTES TO CONSOLIDATED FINANCIAL STATEMENTS — (Continued)
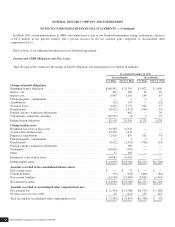
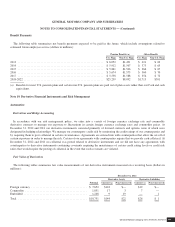
The following table summarizes estimated amounts to be amortized from Accumulated other comprehensive loss into net periodic
benefit cost in the year ended 2013 based on December 31, 2012 plan measurements (dollars in millions):
U.S. Pension
Plans
Non-U.S.
Pension Plans
U.S. Other
Benefit Plans
Non-U.S. Other
Benefit Plans
Amortization of prior service (credit) cost ............................ $(4) $ 20 $(116) $(15)
Amortization of net actuarial loss (gain) .............................. 6 206 91 7
$ 2 $226 $ (25) $ (8)
Assumptions
Healthcare Trend Rate
As a result of previous modifications made to healthcare plans, there are no significant uncapped U.S. healthcare plans remaining,
therefore, the healthcare cost trend rate does not have a significant effect on our U.S. plans. The implementation of the HCT at
October 31, 2011 eliminated significant exposure to changes in the healthcare cost trend rate for non-U.S. plans.
December 31, 2010
Assumed Healthcare Trend Rates
Initial healthcare cost trend rate ................................................................... 5.6%
Ultimate healthcare cost trend rate ................................................................. 3.4%
Number of years to ultimate trend rate .............................................................. 8
Healthcare trend rate assumptions are determined for inclusion in healthcare OPEB valuation at each remeasurement. The
healthcare trend rates are developed using historical cash expenditures and near-term outlook for retiree healthcare. This information
is supplemented with information gathered from actuarial based models, information obtained from healthcare providers and known
significant events.
The following table summarizes the effect of a one-percentage point change in the assumed healthcare trend rates for non-U.S.
plans (dollars in millions):
Effect on 2011
Aggregate Service
and Interest Cost
Effect on
December 31, 2010
APBO
Change in Assumption
One percentage point increase ...................................................... $31 $491
One percentage point decrease ...................................................... $(25) $(392)
Investment Strategies and Long-Term Rate of Return
Detailed periodic studies conducted by outside actuaries and an internal asset management group, consisting of an analysis of
capital market assumptions and employing Monte-Carlo simulations, are used to determine the long-term strategic mix among asset
classes, risk mitigation strategies, and the expected long-term return on asset assumptions for the U.S. pension plans. The U.S. study
includes a review of alternative asset allocation and risk mitigation strategies, anticipated future long-term performance of individual
asset classes, risks evaluated using standard deviation techniques and correlations among the asset classes that comprise the plans’
asset mix. Similar studies are performed for the significant non-U.S. pension plans with the assistance of outside actuaries and asset
managers. While the studies incorporate data from recent plan performance and historical returns, the expected long-term return on
plan asset assumptions are determined based on long-term, prospective rates of return.
General Motors Company 2012 ANNUAL REPORT130