General Motors 2012 Annual Report Download - page 107
Download and view the complete annual report
Please find page 107 of the 2012 General Motors annual report below. You can navigate through the pages in the report by either clicking on the pages listed below, or by using the keyword search tool below to find specific information within the annual report.-
 1
1 -
2
-
3
-
4
-
5
-
6
-
7
-
8
-
9
-
10
-
11
-
12
-
13
-
14
-
15
-
16
-
17
-
18
-
19
-
20
-
21
-
22
-
23
-
24
-
25
-
26
-
27
-
28
-
29
-
30
-
31
-
32
-
33
-
34
-
35
-
36
-
37
-
38
-
39
-
40
-
41
-
42
-
43
-
44
-
45
-
46
-
47
-
48
-
49
-
50
-
51
-
52
-
53
-
54
-
55
-
56
-
57
-
58
-
59
-
60
-
61
-
62
-
63
-
64
-
65
-
66
-
67
-
68
-
69
-
70
-
71
-
72
-
73
-
74
-
75
-
76
-
77
-
78
-
79
-
80
-
81
-
82
-
83
-
84
-
85
-
86
-
87
-
88
-
89
-
90
-
91
-
92
-
93
-
94
-
95
-
96
-
 97
97 -
 98
98 -
 99
99 -
 100
100 -
 101
101 -
 102
102 -
 103
103 -
 104
104 -
 105
105 -
 106
106 -
 107
107 -
 108
108 -
 109
109 -
 110
110 -
 111
111 -
 112
112 -
 113
113 -
 114
114 -
 115
115 -
 116
116 -
 117
117 -
118
-
119
-
120
-
121
-
122
-
123
-
124
-
125
-
126
-
127
-
128
-
129
-
130
-
131
-
132
-
133
-
134
-
135
-
136
-
137
-
138
-
139
-
140
-
141
-
142
-
143
-
144
-
145
-
146
-
147
-
148
-
149
-
150
-
151
-
152
-
153
-
154
-
155
-
156
-
157
-
158
-
159
-
160
-
161
-
162
-
163
-
164
-
165
-
166
-
167
-
168
-
169
-
170
-
171
-
172
-
173
-
174
-
175
-
176
-
177
-
178
-
179
-
180
-
181
-
182
 |
 |

GENERAL MOTORS COMPANY AND SUBSIDIARIES
NOTES TO CONSOLIDATED FINANCIAL STATEMENTS — (Continued)
Transactions with Nonconsolidated Affiliates
Nonconsolidated affiliates are involved in various aspects of the development, production and marketing of cars, trucks and
automobile parts. We purchase component parts and vehicles from certain nonconsolidated affiliates for resale to dealers. The
following tables summarize the effects of transactions with nonconsolidated affiliates (dollars in millions):
Years Ended December 31,
2012 2011 2010
Results of Operations
Automotive sales and revenue ............................................................. $2,572 $3,266 $2,910
Automotive purchases, net ................................................................ $ 497 $1,044 $2,881
Interest income and other non-operating income, net ........................................... $ 184 $ 34 $ 43
December 31, 2012 December 31, 2011
Financial Position
Accounts and notes receivable, net .................................................. $1,668 $1,785
Accounts and notes payable ....................................................... $ 167 $ 342
Deferred revenue and customer deposits ............................................. $ 46 $ 150
Years Ended December 31,
2012 2011 2010
Cash Flows
Operating .............................................................................. $3,385 $3,624 $719
Investing ............................................................................... $ (41) $ (27) $ (74)
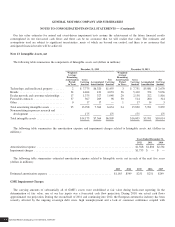
Note 11. Property, net
The following table summarizes the components of Property, net (dollars in millions):
Estimated Useful Lives in Years December 31, 2012 December 31, 2011
Land .................................................. $ 2,107 $ 2,502
Buildings and improvements ............................... 5-40 4,601 4,701
Machinery and equipment ................................. 3-27 12,720 10,670
Construction in progress .................................. 3,018 3,070
Real estate, plants, and equipment .......................... 22,446 20,943
Less: accumulated depreciation ............................. (5,556) (4,611)
Real estate, plants, and equipment, net ....................... 16,890 16,332
Special tools, net ........................................ 1-15 7,306 6,673
Total property, net ....................................... $24,196 $23,005
The following table summarizes the amount of interest capitalized and excluded from Automotive interest expense related to
Property, net (dollars in millions):
Years Ended December 31,
2012 2011 2010
Capitalized interest ..................................................................... $117 $91 $62
General Motors Company 2012 ANNUAL REPORT104