General Motors 2012 Annual Report Download - page 108
Download and view the complete annual report
Please find page 108 of the 2012 General Motors annual report below. You can navigate through the pages in the report by either clicking on the pages listed below, or by using the keyword search tool below to find specific information within the annual report.-
 1
1 -
2
-
3
-
4
-
5
-
6
-
7
-
8
-
9
-
10
-
11
-
12
-
13
-
14
-
15
-
16
-
17
-
18
-
19
-
20
-
21
-
22
-
23
-
24
-
25
-
26
-
27
-
28
-
29
-
30
-
31
-
32
-
33
-
34
-
35
-
36
-
37
-
38
-
39
-
40
-
41
-
42
-
43
-
44
-
45
-
46
-
47
-
48
-
49
-
50
-
51
-
52
-
53
-
54
-
55
-
56
-
57
-
58
-
59
-
60
-
61
-
62
-
63
-
64
-
65
-
66
-
67
-
68
-
69
-
70
-
71
-
72
-
73
-
74
-
75
-
76
-
77
-
78
-
79
-
80
-
81
-
82
-
83
-
84
-
85
-
86
-
87
-
88
-
89
-
90
-
91
-
92
-
93
-
94
-
95
-
96
-
97
-
 98
98 -
 99
99 -
 100
100 -
 101
101 -
 102
102 -
 103
103 -
 104
104 -
 105
105 -
 106
106 -
 107
107 -
 108
108 -
 109
109 -
 110
110 -
 111
111 -
 112
112 -
 113
113 -
 114
114 -
 115
115 -
 116
116 -
 117
117 -
 118
118 -
119
-
120
-
121
-
122
-
123
-
124
-
125
-
126
-
127
-
128
-
129
-
130
-
131
-
132
-
133
-
134
-
135
-
136
-
137
-
138
-
139
-
140
-
141
-
142
-
143
-
144
-
145
-
146
-
147
-
148
-
149
-
150
-
151
-
152
-
153
-
154
-
155
-
156
-
157
-
158
-
159
-
160
-
161
-
162
-
163
-
164
-
165
-
166
-
167
-
168
-
169
-
170
-
171
-
172
-
173
-
174
-
175
-
176
-
177
-
178
-
179
-
180
-
181
-
182
 |
 |

GENERAL MOTORS COMPANY AND SUBSIDIARIES
NOTES TO CONSOLIDATED FINANCIAL STATEMENTS — (Continued)
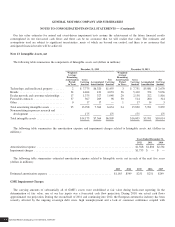
The following table summarizes the amount of capitalized software included in Property, net (dollars in millions):
December 31, 2012 December 31, 2011
Capitalized software in use, net .................................................... $465 $280
Capitalized software in the process of being developed .................................. $108 $113
The following table summarizes depreciation, impairment charges and amortization expense related to Property, net, recorded in
Automotive cost of sales, GM Financial operating and other expenses, Automotive selling, general and administrative expense and
Other automotive expenses, net (dollars in millions):
Years Ended December 31,
2012 2011 2010
Depreciation and amortization expense ...................................................... $3,888 $3,604 $3,576
Impairment charges (a) .................................................................. 3,793 81 240
Depreciation, impairment charges and amortization expense ..................................... $7,681 $3,685 $3,816
Capitalized software amortization expense (b) ................................................ $ 209 $ 203 $ 195
(a) Includes GME assets whose fair value was $408 million at December 31, 2012. Also includes other assets whose fair value was
determined to be $0 in the years ended December 31, 2012, 2011 and 2010 measured utilizing Level 3 inputs. Fair value
measurements of the non-GME asset group long-lived assets utilized projected cash flows discounted at a rate commensurate
with the perceived business risks related to the assets involved.
(b) Included in total depreciation, impairment charges and amortization expense.
GME Impairment Charges
The carrying amounts of substantially all of GME’s assets were established at fair value during fresh-start reporting. In the
determination of fair value, one of our key inputs was a forecasted cash flow projection. During 2010, our actual cash flows
approximated our projection. During the second half of 2011 and continuing into 2012, the European automotive industry has been
severely affected by the ongoing sovereign debt crisis, high unemployment and a lack of consumer confidence coupled with
overcapacity. During this timeframe, we began to experience deterioration in cash flows. In response, we formulated a plan to
implement various actions to strengthen our operations and increase our competitiveness. The key areas of the plan include
investments in our product portfolio, a revised brand strategy, significant management changes, reducing material, development and
production costs, and further leveraging synergies from the alliance between us and PSA.
We believe it is likely that adverse economic conditions, and their effect on the European automotive industry will not improve
significantly in the short-term and we expect to continue to incur losses in the region as a result. During the fourth quarter of 2012,
notwithstanding the above described actions, GME performed below expectations relative to the key operating metrics of forecasted
revenues, market share, and variable profit established in mid-2012. Further, our industry outlook deteriorated, and our forecast of
2013 cash flows declined. This triggered a long-lived asset impairment analysis.
We performed a recoverability test of the GME asset group by weighting various undiscounted cash flow scenarios. The weighting
of the projected cash flows considers the uncertainty in our ability to execute the actions contemplated in our plan which, in part, are
dependent upon actions and factors outside our control. Our test concluded that the GME asset group was not recoverable as the
resulting undiscounted cash flows were less than their carrying amount. Accordingly, we estimated the fair value of the GME long-
lived assets to determine the impairment amount. Determining the fair value is judgmental in nature and requires the use of significant
estimates and assumptions, considered to be Level 3 inputs.
General Motors Company 2012 ANNUAL REPORT 105