General Motors 2012 Annual Report Download - page 50
Download and view the complete annual report
Please find page 50 of the 2012 General Motors annual report below. You can navigate through the pages in the report by either clicking on the pages listed below, or by using the keyword search tool below to find specific information within the annual report.-
 1
1 -
2
-
3
-
4
-
5
-
6
-
7
-
8
-
9
-
10
-
11
-
12
-
13
-
14
-
15
-
16
-
17
-
18
-
19
-
20
-
21
-
22
-
23
-
24
-
25
-
26
-
27
-
28
-
29
-
30
-
31
-
32
-
33
-
34
-
35
-
36
-
37
-
38
-
39
-
 40
40 -
 41
41 -
 42
42 -
 43
43 -
 44
44 -
 45
45 -
 46
46 -
 47
47 -
 48
48 -
 49
49 -
 50
50 -
 51
51 -
 52
52 -
 53
53 -
 54
54 -
 55
55 -
 56
56 -
 57
57 -
 58
58 -
 59
59 -
 60
60 -
61
-
62
-
63
-
64
-
65
-
66
-
67
-
68
-
69
-
70
-
71
-
72
-
73
-
74
-
75
-
76
-
77
-
78
-
79
-
80
-
81
-
82
-
83
-
84
-
85
-
86
-
87
-
88
-
89
-
90
-
91
-
92
-
93
-
94
-
95
-
96
-
97
-
98
-
99
-
100
-
101
-
102
-
103
-
104
-
105
-
106
-
107
-
108
-
109
-
110
-
111
-
112
-
113
-
114
-
115
-
116
-
117
-
118
-
119
-
120
-
121
-
122
-
123
-
124
-
125
-
126
-
127
-
128
-
129
-
130
-
131
-
132
-
133
-
134
-
135
-
136
-
137
-
138
-
139
-
140
-
141
-
142
-
143
-
144
-
145
-
146
-
147
-
148
-
149
-
150
-
151
-
152
-
153
-
154
-
155
-
156
-
157
-
158
-
159
-
160
-
161
-
162
-
163
-
164
-
165
-
166
-
167
-
168
-
169
-
170
-
171
-
172
-
173
-
174
-
175
-
176
-
177
-
178
-
179
-
180
-
181
-
182
 |
 |

GENERAL MOTORS COMPANY AND SUBSIDIARIES
to the termination of the advance wholesale agreements and increased production; and (4) other activities of $2.7 billion which
include non-cash gains relating to the sale of our investments in New Delphi and Ally Financial preferred stock of $1.9 billion.
Significant pension and OPEB related activity included a cash contribution as part of the HCT settlement of $0.8 billion in 2011 and a
voluntary contribution made to our U.S. pension plans of $4.0 billion in 2010. Refer to Note 18 to our consolidated financial
statements for additional information on the HCT settlement.
Investing Activities
In the year ended December 31, 2012 cash flows from investing activities increased by $9.9 billion due primarily to: (1) an increase
in net liquidations of marketable securities of $17.5 billion as we reinvested maturing marketable securities in shorter-term cash
equivalents to rebalance our investment portfolio in the normal course of business; partially offset by (2) proceeds from the sale of our
investments in New Delphi and preferred stock in Ally Financial of $4.8 billion in 2011; (3) increased capital expenditures of
$1.8 billion as we continue to reinvest in our business; (4) a decrease in the release of restricted cash of $0.8 billion related primarily
to the release of restricted cash associated with implementation of the HCT in 2011; and (5) an increase in notes receivable of $0.2
billion.
In the year ended December 31, 2011 cash flows from investing activities decreased by $11.3 billion due primarily to: (1) a
reduction in restricted cash returned from escrow accounts of $11.6 billion; (2) an increase in net acquisitions of marketable securities
with maturities exceeding 90 days of $5.2 billion; and (3) increased capital expenditures of $2.0 billion as we continue to reinvest in
our business; partially offset by (4) proceeds from the sale of our investments in New Delphi and preferred stock in Ally Financial of
$4.8 billion in 2011; and (5) the acquisition of AmeriCredit Corp. for $3.5 billion in 2010. The decrease in restricted cash was due to
the release of $1.0 billion following the implementation of the HCT in 2011 and the release of funds held in an escrow account
relating to the UST Credit Agreement of $12.5 billion in 2010.
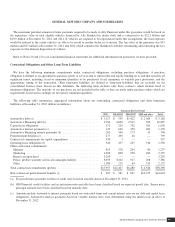
Financing Activities
In the year ended December 31, 2012 cash flows from financing activities decreased by $5.2 billion due primarily to: (1) the
purchase price less the applicable premium to acquire our common stock from the UST of $5.1 billion; and (2) issuance fees paid to
enter into our new secured revolving credit facilities of $0.1 billion in 2012.
In the year ended December 31, 2011 cash flows from financing activities increased by $7.4 billion due primarily to: (1) a reduction
in payments made in excess of proceeds received from debt obligations of $10.0 billion related to the repayment of our indebtedness
under the UST Credit Agreement of $5.7 billion, Canadian Loan of $1.3 billion, principal payments of the VEBA Notes of
$2.5 billion and repayment of GM Korea’s credit facility of $1.2 billion in 2010; and (2) purchase of the Series A Preferred Stock
shares held by the UST of $2.1 billion in 2010; partially offset by (3) proceeds received from the issuance of our Series B Preferred
Stock of $4.9 billion in 2010.
Free Cash Flow and Adjusted Free Cash Flow
Management believes free cash flow and adjusted free cash flow provides meaningful supplemental information regarding the liquidity
of our automotive operations and its ability to generate sufficient cash flow above those required in our business to sustain our operations.
We measure free cash flow as cash flow from operations less capital expenditures. We measure adjusted free cash flow as free cash flow
adjusted for certain voluntary management actions, primarily related to strengthening our balance sheet. These voluntary management
actions represent items that management does not consider when assessing and managing the operational and financial performance of
the organization and its management teams. Management believes that adjusting for these actions allows for greater transparency of
operating trends and performance between periods. While management believes that free cash flow and adjusted free cash flow provide
useful information, they are not operating measures under U.S. GAAP and there are limitations associated with their use. Our calculation
of free cash flow and adjusted free cash flow may not be completely comparable to similarly titled measures of other companies due to
potential differences between companies in the method of calculation. As a result the use of free cash flow and adjusted free cash flow
has limitations and should not be considered in isolation from, or as a substitute for, other measures such as cash flows from operating
General Motors Company 2012 ANNUAL REPORT 47