General Motors 2012 Annual Report Download - page 38
Download and view the complete annual report
Please find page 38 of the 2012 General Motors annual report below. You can navigate through the pages in the report by either clicking on the pages listed below, or by using the keyword search tool below to find specific information within the annual report.-
 1
1 -
2
-
3
-
4
-
5
-
6
-
7
-
8
-
9
-
10
-
11
-
12
-
13
-
14
-
15
-
16
-
17
-
18
-
19
-
20
-
21
-
22
-
23
-
24
-
25
-
26
-
27
-
 28
28 -
 29
29 -
 30
30 -
 31
31 -
 32
32 -
 33
33 -
 34
34 -
 35
35 -
 36
36 -
 37
37 -
 38
38 -
 39
39 -
 40
40 -
 41
41 -
 42
42 -
 43
43 -
 44
44 -
 45
45 -
 46
46 -
 47
47 -
 48
48 -
49
-
50
-
51
-
52
-
53
-
54
-
55
-
56
-
57
-
58
-
59
-
60
-
61
-
62
-
63
-
64
-
65
-
66
-
67
-
68
-
69
-
70
-
71
-
72
-
73
-
74
-
75
-
76
-
77
-
78
-
79
-
80
-
81
-
82
-
83
-
84
-
85
-
86
-
87
-
88
-
89
-
90
-
91
-
92
-
93
-
94
-
95
-
96
-
97
-
98
-
99
-
100
-
101
-
102
-
103
-
104
-
105
-
106
-
107
-
108
-
109
-
110
-
111
-
112
-
113
-
114
-
115
-
116
-
117
-
118
-
119
-
120
-
121
-
122
-
123
-
124
-
125
-
126
-
127
-
128
-
129
-
130
-
131
-
132
-
133
-
134
-
135
-
136
-
137
-
138
-
139
-
140
-
141
-
142
-
143
-
144
-
145
-
146
-
147
-
148
-
149
-
150
-
151
-
152
-
153
-
154
-
155
-
156
-
157
-
158
-
159
-
160
-
161
-
162
-
163
-
164
-
165
-
166
-
167
-
168
-
169
-
170
-
171
-
172
-
173
-
174
-
175
-
176
-
177
-
178
-
179
-
180
-
181
-
182
 |
 |

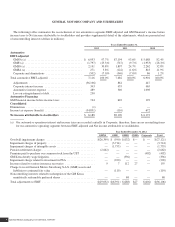
GENERAL MOTORS COMPANY AND SUBSIDIARIES
Current Assets
Marketable securities decreased by $7.2 billion (or 44.3%) due primarily to our reinvesting in shorter-term cash equivalents as these
marketable securities matured to rebalance our securities portfolio in the normal course of business.
GM Financial finance receivables, net increased by $0.8 billion (or 24.4%) due primarily to an increase of new originations and
purchases of consumer and commercial finance receivables, partially offset by principal collections.
Equipment on operating lease, net decreased by $0.7 billion (or 27.7%) due primarily to depreciation expense and impairment
charges of $0.4 billion in the year ended December 31, 2012 and a net decrease of $0.3 billion in vehicles under lease.
Deferred income taxes increased by $8.9 billion due primarily to the valuation allowance reversals in the U.S. and Canada.
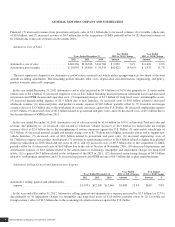
Non-Current Assets
Restricted cash and marketable securities decreased by $0.5 billion (or 44.5%) due primarily to the release of restricted cash and
marketable securities that previously served as collateral on various performance guarantees that are no longer required.
GM Financial finance receivables, net increased by $1.0 billion (or 17.6%) due primarily to an increase of new originations and
purchases of consumer and commercial finance receivables, partially offset by expected principal payments considered current.
Goodwill decreased by $27.0 billion (or 93.2%) due to the impairment charges in GMNA of $26.4 billion and in GME of $0.6
billion and GMIO of $0.2 billion; partially offset by additions of $0.1 billion related to the acquisition of SAIC GM Investment
Limited, the holding company of General Motors India Private Limited and Chevrolet Sales India Private Limited (collectively
HKJV).
Intangible assets, net decreased by $3.2 billion (or 32.0%) due primarily to impairment charges in GME of $1.8 billion and
amortization of $1.6 billion; partially offset by additions of $0.1 billion related to the acquisition of HKJV.
GM Financial equipment on operating leases, net increased by $0.9 billion (or 110.1%) due primarily to a net increase in leased
vehicles purchased in the U.S. and Canada of $1.2 billion; partially offset by depreciation of $0.2 billion.
Deferred income taxes increased by $27.4 billion due primarily to the valuation allowance reversals in the U.S. and Canada.
Non-Current Liabilities
GM Financial long-term debt increased by $2.7 billion (or 60.8%) due primarily to: (1) the issuance of securitization notes payable
of $4.1 billion; (2) the issuance of 4.75% senior notes of $1.0 billion; partially offset by (3) long-term debt reclassed to current of $2.5
billion.
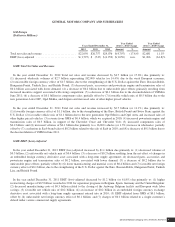
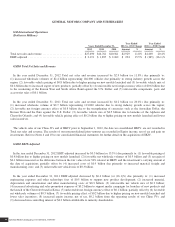
GM North America
(Dollars in Millions)
Years Ended December 31,
Year Ended
2012 vs. 2011 Change
Year Ended
2011 vs. 2010 Change
2012 2011 2010 Amount % Amount %
Total net sales and revenue .......................... $94,595 $90,233 $83,035 $4,362 4.8% $7,198 8.7%
EBIT-adjusted .................................... $ 6,953 $ 7,194 $ 5,688 $ (241) (3.4)% $1,506 26.5%
General Motors Company 2012 ANNUAL REPORT 35