General Motors 2012 Annual Report Download - page 39
Download and view the complete annual report
Please find page 39 of the 2012 General Motors annual report below. You can navigate through the pages in the report by either clicking on the pages listed below, or by using the keyword search tool below to find specific information within the annual report.-
 1
1 -
2
-
3
-
4
-
5
-
6
-
7
-
8
-
9
-
10
-
11
-
12
-
13
-
14
-
15
-
16
-
17
-
18
-
19
-
20
-
21
-
22
-
23
-
24
-
25
-
26
-
27
-
28
-
 29
29 -
 30
30 -
 31
31 -
 32
32 -
 33
33 -
 34
34 -
 35
35 -
 36
36 -
 37
37 -
 38
38 -
 39
39 -
 40
40 -
 41
41 -
 42
42 -
 43
43 -
 44
44 -
 45
45 -
 46
46 -
 47
47 -
 48
48 -
 49
49 -
50
-
51
-
52
-
53
-
54
-
55
-
56
-
57
-
58
-
59
-
60
-
61
-
62
-
63
-
64
-
65
-
66
-
67
-
68
-
69
-
70
-
71
-
72
-
73
-
74
-
75
-
76
-
77
-
78
-
79
-
80
-
81
-
82
-
83
-
84
-
85
-
86
-
87
-
88
-
89
-
90
-
91
-
92
-
93
-
94
-
95
-
96
-
97
-
98
-
99
-
100
-
101
-
102
-
103
-
104
-
105
-
106
-
107
-
108
-
109
-
110
-
111
-
112
-
113
-
114
-
115
-
116
-
117
-
118
-
119
-
120
-
121
-
122
-
123
-
124
-
125
-
126
-
127
-
128
-
129
-
130
-
131
-
132
-
133
-
134
-
135
-
136
-
137
-
138
-
139
-
140
-
141
-
142
-
143
-
144
-
145
-
146
-
147
-
148
-
149
-
150
-
151
-
152
-
153
-
154
-
155
-
156
-
157
-
158
-
159
-
160
-
161
-
162
-
163
-
164
-
165
-
166
-
167
-
168
-
169
-
170
-
171
-
172
-
173
-
174
-
175
-
176
-
177
-
178
-
179
-
180
-
181
-
182
 |
 |

GENERAL MOTORS COMPANY AND SUBSIDIARIES
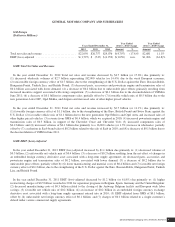
GMNA Total Net Sales and Revenue
In the year ended December 31, 2012 Total net sales and revenue increased by $4.4 billion (or 4.8%) due primarily to: (1) increased
wholesale volumes of $3.9 billion representing 156,000 vehicles (or 4.9%) due to increased industry demand and successful recent
vehicle launches such as the Buick Verano, Cadillac ATS, Cadillac XTS, Chevrolet Sonic and Chevrolet Spark; (2) favorable vehicle
mix of $1.1 billion; and (3) favorable vehicle pricing of $0.5 billion; partially offset by (4) reduction in favorable lease residual
adjustments of $0.5 billion; and (5) unfavorable net foreign currency effect of $0.2 billion due to the weakening of the CAD and
Mexican Peso against the U.S. Dollar.
In the year ended December 31, 2011 Total net sales and revenue increased by $7.2 billion (or 8.7%) due primarily to: (1) increased
wholesale volumes of $7.3 billion representing 299,000 vehicles (or 10.3%) due to increased industry demand and successful recent
vehicle launches such as the Chevrolet Cruze, Chevrolet Equinox and GMC Terrain; (2) favorable vehicle pricing of $1.1 billion;
(3) increased revenues from Customer Care and Aftersales of $0.4 billion due to increased volumes; and (4) favorable net foreign
currency effect of $0.3 billion due to the strengthening of the CAD against the U.S. Dollar; partially offset by (5) unfavorable vehicle
mix of $1.1 billion; and (6) decreased revenue of $1.0 billion due to the sale of Nexteer in November 2010.
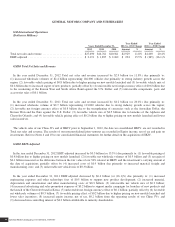
GMNA EBIT -Adjusted
The most significant factors which influence GMNA’s profitability are industry volume (primarily U.S. seasonally adjusted annual
rate) and market share. While not as significant as industry volume and market share, another factor affecting profitability is the
relative mix of vehicles (cars, trucks, crossovers) sold. Variable profit is a key indicator of product profitability. Variable profit is
defined as revenue less material cost, freight, the variable component of manufacturing expense, and policy and warranty expense.
Vehicles with higher selling prices generally have higher variable profit. Trucks sold in the U.S. currently have a variable profit of
approximately 150% of our portfolio on a weighted-average basis. Crossover vehicles’ variable profits are in line with the overall
portfolio on a weighted-average basis, and cars are approximately 50% of the portfolio on a weighted-average basis.
In the year ended December 31, 2012 EBIT-adjusted decreased by $0.2 billion (or 3.4%) due primarily to: (1) decrease in U.S.
pension income of $0.8 billion due to December 31, 2011 plan remeasurements; (2) increase in manufacturing expense, including new
launches, of $0.6 billion; (3) reduction in favorable lease residual adjustments of $0.5 billion; (4) unfavorable net vehicle mix of $0.3
billion; and (5) unfavorable policy and warranty adjustments of $0.2 billion; partially offset by (6) increased net wholesale volumes of
$1.1 billion due to increased industry demand and successful recent vehicle launches; (7) favorable vehicle pricing effect of
$0.5 billion; (8) decreased material prices and freight of $0.4 billion; and (9) decreased engineering expense and other technology fees
of $0.3 billion.
In the year ended December 31, 2011 EBIT-adjusted increased by $1.5 billion (or 26.5%) due primarily to: (1) increased net
wholesale volumes of $1.9 billion due to increased industry demand and successful recent vehicle launches; (2) favorable vehicle
pricing effect of $1.1 billion; (3) decreased amortization expense of $0.7 billion due to the effect of double-declining amortization of
technology intangibles which were recorded on July 10, 2009 and impairment charges for long-lived assets in 2010; (4) favorable
foreign currency effect of $0.5 billion due to the weakening of the CAD against the U.S. Dollar; and (5) increase in net pension and
OPEB income of $0.3 billion due to December 31, 2010 plan remeasurements; partially offset by (6) unfavorable net vehicle mix of
$1.8 billion; (7) increased engineering expense and other technology fees of $0.5 billion to support new product development;
(8) increased material prices and freight of $0.4 billion; and (9) reduction in favorable adjustments of $0.4 billion to restructuring
reserves due to increased production capacity utilization and revisions to productivity initiatives in 2010.
General Motors Company 2012 ANNUAL REPORT36