General Motors 2012 Annual Report Download - page 134
Download and view the complete annual report
Please find page 134 of the 2012 General Motors annual report below. You can navigate through the pages in the report by either clicking on the pages listed below, or by using the keyword search tool below to find specific information within the annual report.-
 1
1 -
2
-
3
-
4
-
5
-
6
-
7
-
8
-
9
-
10
-
11
-
12
-
13
-
14
-
15
-
16
-
17
-
18
-
19
-
20
-
21
-
22
-
23
-
24
-
25
-
26
-
27
-
28
-
29
-
30
-
31
-
32
-
33
-
34
-
35
-
36
-
37
-
38
-
39
-
40
-
41
-
42
-
43
-
44
-
45
-
46
-
47
-
48
-
49
-
50
-
51
-
52
-
53
-
54
-
55
-
56
-
57
-
58
-
59
-
60
-
61
-
62
-
63
-
64
-
65
-
66
-
67
-
68
-
69
-
70
-
71
-
72
-
73
-
74
-
75
-
76
-
77
-
78
-
79
-
80
-
81
-
82
-
83
-
84
-
85
-
86
-
87
-
88
-
89
-
90
-
91
-
92
-
93
-
94
-
95
-
96
-
97
-
98
-
99
-
100
-
101
-
102
-
103
-
104
-
105
-
106
-
107
-
108
-
109
-
110
-
111
-
112
-
113
-
114
-
115
-
116
-
117
-
118
-
119
-
120
-
121
-
122
-
123
-
 124
124 -
 125
125 -
 126
126 -
 127
127 -
 128
128 -
 129
129 -
 130
130 -
 131
131 -
 132
132 -
 133
133 -
 134
134 -
 135
135 -
 136
136 -
 137
137 -
 138
138 -
 139
139 -
 140
140 -
 141
141 -
 142
142 -
 143
143 -
 144
144 -
145
-
146
-
147
-
148
-
149
-
150
-
151
-
152
-
153
-
154
-
155
-
156
-
157
-
158
-
159
-
160
-
161
-
162
-
163
-
164
-
165
-
166
-
167
-
168
-
169
-
170
-
171
-
172
-
173
-
174
-
175
-
176
-
177
-
178
-
179
-
180
-
181
-
182
 |
 |

GENERAL MOTORS COMPANY AND SUBSIDIARIES
NOTES TO CONSOLIDATED FINANCIAL STATEMENTS — (Continued)
The strategic asset mix and risk mitigation strategies for the plans are tailored specifically for each plan. Individual plans have
distinct liabilities, liquidity needs, and regulatory requirements. Consequently, there are different investment policies set by individual
plan fiduciaries. Although investment policies and risk mitigation strategies may differ among plans, each investment strategy is
considered to be appropriate in the context of the specific factors affecting each plan.
In setting new strategic asset mixes, consideration is given to the likelihood that the selected mixes will effectively fund the
projected pension plan liabilities, while aligning with the risk tolerance of the plans’ fiduciaries. The strategic asset mixes for U.S.
defined benefit pension plans are increasingly designed to satisfy the complementary objectives of reaching fully funded positions
(market value of assets equal to or greater than the present value of the liabilities) and mitigating the possibility of a deterioration in
funded status.
Derivatives may be used to provide cost effective solutions for rebalancing investment portfolios, increasing or decreasing exposure
to various asset classes and for mitigating risks, primarily interest rate and currency risks. Equity and fixed income managers are
permitted to utilize derivatives as efficient substitutes for traditional physical securities. Interest rate derivatives may be used to adjust
portfolio duration to align with a plan’s targeted investment policy. Alternative investment managers are permitted to employ
leverage, including through the use of derivatives, which may alter economic exposure.
In January 2013 an investment policy study was completed for the U.S. pension plans taking into account the new plan
structures that followed the derisking initiatives and annuity transactions executed during the second half of 2012. The study resulted
in new target asset allocations being approved for the U.S. pension plans with resulting changes to the expected long-term return on
assets. The weighted-average long-term return on assets decreased from 6.2% at December 31, 2011 to 5.8% due primarily to lower
yields on fixed income securities. The U.S. hourly plan assets now represent 91% of the total U.S. pension plan assets compared to
65% at the end of 2011.
The expected long-term return on plan assets used in determining pension expense for non-U.S. plans is determined in a similar
manner to the U.S. plans. The rates of 6.2% and 6.5% for the years ended December 31, 2012 and 2011 represent weighted-average
rates of all of the funded non-U.S. plans.
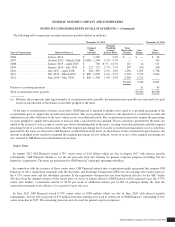
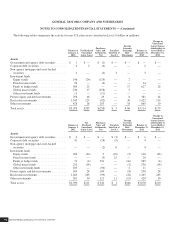
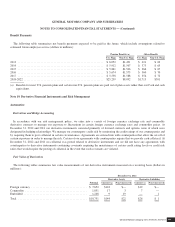
Target Allocation Percentages
The following table summarizes the target allocations by asset category for U.S. and non-U.S. defined benefit pension plans:
December 31, 2012 December 31, 2011
U.S. Plans Non-U.S. Plans U.S. Plans Non-U.S. Plans
Asset Categories
Equity ........................................................... 19% 30% 14% 34%
Debt ............................................................. 60% 53% 66% 45%
Alternatives (a) .................................................... 21% 17% 20% 21%
Total ............................................................. 100% 100% 100% 100%
(a) Includes private equity, real estate and absolute return strategies which primarily consist of hedge funds.
General Motors Company 2012 ANNUAL REPORT 131