General Motors 2012 Annual Report Download - page 106
Download and view the complete annual report
Please find page 106 of the 2012 General Motors annual report below. You can navigate through the pages in the report by either clicking on the pages listed below, or by using the keyword search tool below to find specific information within the annual report.-
 1
1 -
2
-
3
-
4
-
5
-
6
-
7
-
8
-
9
-
10
-
11
-
12
-
13
-
14
-
15
-
16
-
17
-
18
-
19
-
20
-
21
-
22
-
23
-
24
-
25
-
26
-
27
-
28
-
29
-
30
-
31
-
32
-
33
-
34
-
35
-
36
-
37
-
38
-
39
-
40
-
41
-
42
-
43
-
44
-
45
-
46
-
47
-
48
-
49
-
50
-
51
-
52
-
53
-
54
-
55
-
56
-
57
-
58
-
59
-
60
-
61
-
62
-
63
-
64
-
65
-
66
-
67
-
68
-
69
-
70
-
71
-
72
-
73
-
74
-
75
-
76
-
77
-
78
-
79
-
80
-
81
-
82
-
83
-
84
-
85
-
86
-
87
-
88
-
89
-
90
-
91
-
92
-
93
-
94
-
95
-
 96
96 -
 97
97 -
 98
98 -
 99
99 -
 100
100 -
 101
101 -
 102
102 -
 103
103 -
 104
104 -
 105
105 -
 106
106 -
 107
107 -
 108
108 -
 109
109 -
 110
110 -
 111
111 -
 112
112 -
 113
113 -
 114
114 -
 115
115 -
 116
116 -
117
-
118
-
119
-
120
-
121
-
122
-
123
-
124
-
125
-
126
-
127
-
128
-
129
-
130
-
131
-
132
-
133
-
134
-
135
-
136
-
137
-
138
-
139
-
140
-
141
-
142
-
143
-
144
-
145
-
146
-
147
-
148
-
149
-
150
-
151
-
152
-
153
-
154
-
155
-
156
-
157
-
158
-
159
-
160
-
161
-
162
-
163
-
164
-
165
-
166
-
167
-
168
-
169
-
170
-
171
-
172
-
173
-
174
-
175
-
176
-
177
-
178
-
179
-
180
-
181
-
182
 |
 |

GENERAL MOTORS COMPANY AND SUBSIDIARIES
NOTES TO CONSOLIDATED FINANCIAL STATEMENTS — (Continued)
VMM Deconsolidation
In June 2011 we entered into a new shareholder agreement with Fiat Powertrain Technologies SPA related to VM Motori (VMM)
in Italy. Under the new shareholder agreement, we retain 50% ownership but no longer have control. Accordingly, we removed the
assets and liabilities of VMM, which included allocated goodwill of $36 million from our GME reporting unit, from our consolidated
balance sheets and recorded an equity interest in the amount of $46 million.
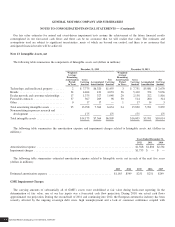
Investment in and Summarized Financial Data of Nonconsolidated Affiliates
The following table summarizes the carrying amount of investments in nonconsolidated affiliates (dollars in millions):
December 31, 2012 December 31, 2011
China JVs ..................................................................... $6,579 $6,452
Other investments ............................................................... 304 338
Total equity in net assets of nonconsolidated affiliates .................................. $6,883 $6,790
At December 31, 2012 and 2011 the carrying amount of our investments in certain joint ventures exceeded our share of the
underlying net assets by $3.8 billion. These differences are primarily related to the application of fresh-start reporting and purchase of
additional interests in nonconsolidated affiliates, of which $3.4 billion and $3.3 billion at December 31, 2012 and 2011 were allocated
to goodwill and the remainder was allocated to the underlying assets and liabilities, primarily intangibles, and are being amortized
over their useful lives.
The following tables present summarized financial data for all of our nonconsolidated affiliates (dollars in millions):
December 31, 2012 December 31, 2011
China JVs Others Total China JVs Others Total
Summarized Balance Sheet Data
Current assets .............................................. $11,759 $2,642 $14,401 $10,882 $2,274 $13,156
Non-current assets .......................................... 6,766 1,507 8,273 5,293 1,863 7,156
Total assets ................................................ $18,525 $4,149 $22,674 $16,175 $4,137 $20,312
Current liabilities ........................................... $12,612 $1,893 $14,505 $10,526 $1,492 $12,018
Non-current liabilities ....................................... 756 758 1,514 651 934 1,585
Total liabilities ............................................. $13,368 $2,651 $16,019 $11,177 $2,426 $13,603
Non-controlling interests ..................................... $ 1,055 $ 1 $ 1,056 $ 948 $ — $ 948
Years Ended December 31,
2012 2011 2010
Summarized Operating Data
China JV’s net sales .................................................................. $33,364 $30,511 $25,395
Others’ net sales ..................................................................... 3,963 4,242 17,500
Total net sales ...................................................................... $37,327 $34,753 $42,895
China JV’s net income ................................................................ $ 3,198 $ 3,203 $ 2,808
Others’ net income (loss) .............................................................. (23) (13) 656
Total net income .................................................................... $ 3,175 $ 3,190 $ 3,464
General Motors Company 2012 ANNUAL REPORT 103