General Motors 2012 Annual Report Download - page 42
Download and view the complete annual report
Please find page 42 of the 2012 General Motors annual report below. You can navigate through the pages in the report by either clicking on the pages listed below, or by using the keyword search tool below to find specific information within the annual report.-
 1
1 -
2
-
3
-
4
-
5
-
6
-
7
-
8
-
9
-
10
-
11
-
12
-
13
-
14
-
15
-
16
-
17
-
18
-
19
-
20
-
21
-
22
-
23
-
24
-
25
-
26
-
27
-
28
-
29
-
30
-
31
-
 32
32 -
 33
33 -
 34
34 -
 35
35 -
 36
36 -
 37
37 -
 38
38 -
 39
39 -
 40
40 -
 41
41 -
 42
42 -
 43
43 -
 44
44 -
 45
45 -
 46
46 -
 47
47 -
 48
48 -
 49
49 -
 50
50 -
 51
51 -
 52
52 -
53
-
54
-
55
-
56
-
57
-
58
-
59
-
60
-
61
-
62
-
63
-
64
-
65
-
66
-
67
-
68
-
69
-
70
-
71
-
72
-
73
-
74
-
75
-
76
-
77
-
78
-
79
-
80
-
81
-
82
-
83
-
84
-
85
-
86
-
87
-
88
-
89
-
90
-
91
-
92
-
93
-
94
-
95
-
96
-
97
-
98
-
99
-
100
-
101
-
102
-
103
-
104
-
105
-
106
-
107
-
108
-
109
-
110
-
111
-
112
-
113
-
114
-
115
-
116
-
117
-
118
-
119
-
120
-
121
-
122
-
123
-
124
-
125
-
126
-
127
-
128
-
129
-
130
-
131
-
132
-
133
-
134
-
135
-
136
-
137
-
138
-
139
-
140
-
141
-
142
-
143
-
144
-
145
-
146
-
147
-
148
-
149
-
150
-
151
-
152
-
153
-
154
-
155
-
156
-
157
-
158
-
159
-
160
-
161
-
162
-
163
-
164
-
165
-
166
-
167
-
168
-
169
-
170
-
171
-
172
-
173
-
174
-
175
-
176
-
177
-
178
-
179
-
180
-
181
-
182
 |
 |

GENERAL MOTORS COMPANY AND SUBSIDIARIES
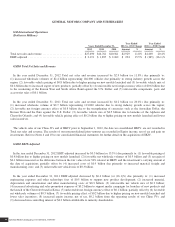
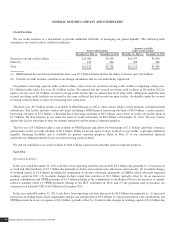
GM South America
(Dollars in Millions)
Years Ended December 31,
Year Ended
2012 vs. 2011 Change
Year Ended
2011 vs. 2010 Change
2012 2011 2010 Amount % Amount %
Total net sales and revenue ......................... $16,950 $16,877 $15,379 $ 73 0.4% $1,498 9.7%
EBIT (loss)-adjusted .............................. $ 271 $ (122) $ 818 $393 n.m. $ (940) n.m.
n.m. = not meaningful
GMSA Total Net Sales and Revenue
In the year ended December 31, 2012 Total net sales and revenue increased by $0.1 billion (or 0.4%) due primarily to: (1) favorable
vehicle mix of $1.6 billion due to increased sales of Chevrolet Cruze and Chevrolet S10; (2) favorable vehicle pricing effect of $0.5
billion, primarily in Argentina due to higher inflation and in Venezuela due to the hyperinflationary economy; and (3) increased
revenue from parts and accessories sales of $0.1 billion; partially offset by (4) unfavorable net foreign currency effect of $1.5 billion,
due to the strengthening of the U.S. dollar against major currencies such as the Brazilian Real and Argentinian Peso; and (5) decreased
wholesale volumes of $0.6 billion representing 44,000 vehicles (or 4.0%) due to deteriorated market share driven by increased
competition and aggressive pricing in the market.
In the year ended December 31, 2011 Total net sales and revenue increased by $1.5 billion (or 9.7%) due primarily to: (1) increased
wholesale volumes of $0.6 billion representing 59,000 vehicles (or 5.7%) due to improved macroeconomic conditions and industry
growth throughout the region; (2) favorable net foreign currency effect of $0.5 billion, due to the strengthening of currencies such as
the Brazilian Real and Colombian Peso against the U.S. Dollar; (3) favorable vehicle pricing effect of $0.3 billion, due primarily to
the hyperinflationary economy in Venezuela; and (4) favorable vehicle mix of $0.1 billion due primarily to increased sales of the
Chevrolet Cruze.
GMSA EBIT (Loss)-Adjusted
In the year ended December 31, 2012 EBIT-adjusted was $0.3 billion compared to EBIT (loss)-adjusted of $0.1 billion in the year
ended December 31, 2011 due primarily to: (1) favorable net vehicle mix of $0.5 billion due to increased sales of Chevrolet Cruze and
Chevrolet S10; (2) favorable vehicle pricing effect of $0.5 billion, primarily in Argentina due to higher inflation and in Venezuela due
to the hyperinflationary economy; (3) decreases in contingency reserves of $0.1 billion due to the resolution of certain items at
amounts lower than previously expected; and (4) a bargain purchase gain of $50 million on the purchase of GMAC Venezuela;
partially offset by (5) increased material, freight and manufacturing costs of $0.5 billion, (6) unfavorable net wholesale volumes of
$0.2 billion; and (7) increased administrative and advertising and sales promotion expenses of $0.1 billion to support launches of new
products.
In the year ended December 31, 2011 EBIT-adjusted was a loss of $0.1 billion compared to EBIT-adjusted of $0.8 billion in the
year ended December 31, 2010 due primarily to: (1) increased material and freight of $0.7 billion; (2) increased manufacturing costs
of $0.3 billion; and (3) foreign currency transaction gains of $0.3 billion recorded in 2010 due to preferential foreign currency
exchange rates in Venezuela, which were discontinued in 2011; and (4) unfavorable $0.1 billion related to separation costs; partially
offset by (5) favorable vehicle pricing effect of $0.3 billion due primarily to the hyperinflationary economy in Venezuela.
In January 2010 the Venezuelan government announced that the official fixed exchange rate of 2.15 BsF to $1.00 would be changed
to a dual rate system that includes a 2.60 BsF to $1.00 essentials rate for food, technology and heavy machine importers and a 4.30
BsF to $1.00 non-essentials rate for all others. This devaluation required remeasurement of our Venezuelan subsidiaries’ non-
U.S. Dollar denominated monetary assets and liabilities. We used a rate of 4.30 BsF to $1.00 to determine the remeasurement, which
resulted in a charge of $25 million recorded in Automotive cost of sales in the year ended December 31, 2010.
General Motors Company 2012 ANNUAL REPORT 39