General Motors 2012 Annual Report Download - page 51
Download and view the complete annual report
Please find page 51 of the 2012 General Motors annual report below. You can navigate through the pages in the report by either clicking on the pages listed below, or by using the keyword search tool below to find specific information within the annual report.-
 1
1 -
2
-
3
-
4
-
5
-
6
-
7
-
8
-
9
-
10
-
11
-
12
-
13
-
14
-
15
-
16
-
17
-
18
-
19
-
20
-
21
-
22
-
23
-
24
-
25
-
26
-
27
-
28
-
29
-
30
-
31
-
32
-
33
-
34
-
35
-
36
-
37
-
38
-
39
-
40
-
 41
41 -
 42
42 -
 43
43 -
 44
44 -
 45
45 -
 46
46 -
 47
47 -
 48
48 -
 49
49 -
 50
50 -
 51
51 -
 52
52 -
 53
53 -
 54
54 -
 55
55 -
 56
56 -
 57
57 -
 58
58 -
 59
59 -
 60
60 -
 61
61 -
62
-
63
-
64
-
65
-
66
-
67
-
68
-
69
-
70
-
71
-
72
-
73
-
74
-
75
-
76
-
77
-
78
-
79
-
80
-
81
-
82
-
83
-
84
-
85
-
86
-
87
-
88
-
89
-
90
-
91
-
92
-
93
-
94
-
95
-
96
-
97
-
98
-
99
-
100
-
101
-
102
-
103
-
104
-
105
-
106
-
107
-
108
-
109
-
110
-
111
-
112
-
113
-
114
-
115
-
116
-
117
-
118
-
119
-
120
-
121
-
122
-
123
-
124
-
125
-
126
-
127
-
128
-
129
-
130
-
131
-
132
-
133
-
134
-
135
-
136
-
137
-
138
-
139
-
140
-
141
-
142
-
143
-
144
-
145
-
146
-
147
-
148
-
149
-
150
-
151
-
152
-
153
-
154
-
155
-
156
-
157
-
158
-
159
-
160
-
161
-
162
-
163
-
164
-
165
-
166
-
167
-
168
-
169
-
170
-
171
-
172
-
173
-
174
-
175
-
176
-
177
-
178
-
179
-
180
-
181
-
182
 |
 |

GENERAL MOTORS COMPANY AND SUBSIDIARIES
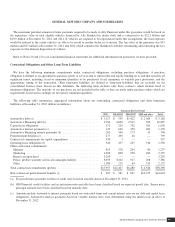
activities. Due to these limitations, free cash flow and adjusted free cash flow are used as supplements to U.S. GAAP measures. The
following table summarizes free cash flow and adjusted free cash flow (dollars in millions):
Years Ended December 31,
2012 2011 2010
Operating cash flow ................................................................... $9,631 $ 7,429 $ 6,589
Less: capital expenditures .............................................................. (8,055) (6,241) (4,200)
Free cash flow ....................................................................... 1,576 1,188 2,389
Adjustments for voluntary management actions ............................................. 2,712 1,830 4,000
Adjusted free cash flow ................................................................ $4,288 $ 3,018 $ 6,389
Adjustments for voluntary management actions include the following items: voluntary contributions to the Retiree Plan of $2.3
billion for the purchase of annuity contracts and the premium paid to purchase our common stock from the UST of $0.4 billion in
December 2012; termination of in-transit wholesale advance agreement in GMNA resulting in an increase to accounts receivable of
$1.1 billion and OPEB payments relating to the HCT settlement of $0.8 billion in 2011; and a voluntary contribution to our U.S.
hourly and salaried defined benefit pension plans of $4.0 billion in 2010.
Other Liquidity Issues
Status of Credit Ratings
We receive credit ratings from four independent credit rating agencies: DBRS Limited, Fitch Ratings (Fitch), Moody’s Investor
Service (Moody’s) and Standard & Poor’s (S&P).
Moody’s, Fitch and S&P currently rate our corporate credit at non-investment grade while DBRS Limited rates our corporate credit
as investment grade. The following table summarizes our credit ratings at February 8, 2013:
Rating Agency Corporate Secured Revolving Credit Facilities Outlook
DBRS Limited .............. BBB(low) N/A Stable
Fitch ...................... BB+ BBB- Stable
Moody’s ................... Ba1 Baa2 Positive
S&P....................... BB+ BBB Stable
Rating actions taken by each of the credit rating agencies from January 1, 2012 through February 8, 2013 were as follows:
DBRS Limited: September 2012 — Upgraded corporate rating to BBB (low) from BB (high).
Fitch: November 2012 — Assigned a rating of BBB- to our secured revolving credit facilities.
August 2012 — Upgraded corporate rating to BB+ from BB and changed their outlook to stable from positive.
Moody’s: November 2012 — Assigned a rating of Baa2 to our secured revolving credit facilities.
S&P: November 2012 — Assigned a rating of BBB to our secured revolving credit facilities.
We continue to pursue investment grade status by maintaining a balance sheet with minimal financial leverage and demonstrating
continued operating performance. Achieving investment grade status will provide us with greater financial flexibility, lower our cost
of borrowing and may release collateral from certain agreements including our secured revolving credit facilities.
General Motors Company 2012 ANNUAL REPORT48