General Motors 2012 Annual Report Download - page 59
Download and view the complete annual report
Please find page 59 of the 2012 General Motors annual report below. You can navigate through the pages in the report by either clicking on the pages listed below, or by using the keyword search tool below to find specific information within the annual report.-
 1
1 -
2
-
3
-
4
-
5
-
6
-
7
-
8
-
9
-
10
-
11
-
12
-
13
-
14
-
15
-
16
-
17
-
18
-
19
-
20
-
21
-
22
-
23
-
24
-
25
-
26
-
27
-
28
-
29
-
30
-
31
-
32
-
33
-
34
-
35
-
36
-
37
-
38
-
39
-
40
-
41
-
42
-
43
-
44
-
45
-
46
-
47
-
48
-
 49
49 -
 50
50 -
 51
51 -
 52
52 -
 53
53 -
 54
54 -
 55
55 -
 56
56 -
 57
57 -
 58
58 -
 59
59 -
 60
60 -
 61
61 -
 62
62 -
 63
63 -
 64
64 -
 65
65 -
 66
66 -
 67
67 -
 68
68 -
 69
69 -
70
-
71
-
72
-
73
-
74
-
75
-
76
-
77
-
78
-
79
-
80
-
81
-
82
-
83
-
84
-
85
-
86
-
87
-
88
-
89
-
90
-
91
-
92
-
93
-
94
-
95
-
96
-
97
-
98
-
99
-
100
-
101
-
102
-
103
-
104
-
105
-
106
-
107
-
108
-
109
-
110
-
111
-
112
-
113
-
114
-
115
-
116
-
117
-
118
-
119
-
120
-
121
-
122
-
123
-
124
-
125
-
126
-
127
-
128
-
129
-
130
-
131
-
132
-
133
-
134
-
135
-
136
-
137
-
138
-
139
-
140
-
141
-
142
-
143
-
144
-
145
-
146
-
147
-
148
-
149
-
150
-
151
-
152
-
153
-
154
-
155
-
156
-
157
-
158
-
159
-
160
-
161
-
162
-
163
-
164
-
165
-
166
-
167
-
168
-
169
-
170
-
171
-
172
-
173
-
174
-
175
-
176
-
177
-
178
-
179
-
180
-
181
-
182
 |
 |

GENERAL MOTORS COMPANY AND SUBSIDIARIES
the asset classes that comprise the plans’ asset mix. While the studies give appropriate consideration to recent plan performance and
historical returns, the assumptions are primarily long-term, prospective rates of return.
In January 2013 an investment policy study was completed for the U.S. pension plans taking into account the new plan
structures that followed the derisking initiatives and annuity transactions executed during the second half of 2012. The study resulted
in new target asset allocations being approved for the U.S. pension plans with resulting changes to the expected long-term return on
assets. The weighted-average long-term return on assets decreased from 6.2% at December 31, 2011 to 5.8% due primarily to lower
yields on fixed income securities. The U.S. hourly plan assets now represent 91% of the total U.S. pension plan assets compared to
65% at the end of 2011.
Another key assumption in determining net pension expense is the assumed discount rate to be used to discount plan obligations.
We estimate this rate for U.S. plans using a cash flow matching approach, which uses projected cash flows matched to spot rates along
a high quality corporate yield curve to determine the present value of cash flows to calculate a single equivalent discount rate.
Significant differences in actual experience or significant changes in assumptions may materially affect the pension obligations.
The effect of actual results differing from assumptions and the changing of assumptions are included in unamortized net actuarial
gains and losses that are subject to amortization to expense over future periods.
The following table summarizes the unamortized actuarial loss (before tax) on pension plans (dollars in billions):
December 31, 2012 December 31, 2011
Unamortized actuarial loss ........................................................ $6.2 $3.8
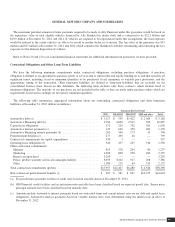
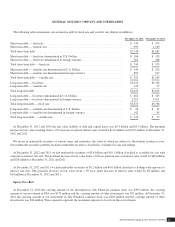
The following table illustrates the sensitivity to a change in certain assumptions for the pension plans, holding all other assumptions
constant (dollars in millions):
U.S. Plans Non-U.S. Plans
Effect on 2013
Pension
Expense
Effect on
December 31,
2012 PBO
Effect on 2013
Pension
Expense
Effect on
December 31,
2012 PBO
25 basis point decrease in discount rate .............................. ⳮ$ 110 +$ 2,250 +$ 65 +$ 943
25 basis point increase in discount rate .............................. +$ 100 ⳮ$ 2,190 ⳮ$ 56 ⳮ$ 892
25 basis point decrease in expected return on assets .................... +$ 160 N/A +$ 37 N/A
25 basis point increase in expected return on assets .................... ⳮ$ 150 N/A ⳮ$ 37 N/A
The following data illustrates the sensitivity of changes in pension expense and pension obligation based on the last remeasurement
of the U.S. hourly pension plan at December 31, 2012 (dollars in millions):
Effect on 2013
Pension Expense
Effect on December 31, 2012
PBO
Change in future benefit units
One percentage point increase in benefit units .................................... +$ 74 +$ 227
One percentage point decrease in benefit units .................................... ⳮ$ 72 ⳮ$ 220
Refer to Note 18 to our consolidated financial statements for the expected weighted-average long-term rate of return on plan assets,
weighted-average discount rate on plan obligations and actual and expected return on plan assets. Refer to Note 3 to our consolidated
financial statements for a discussion of the inputs used to determine fair value for each significant asset class or category.
General Motors Company 2012 ANNUAL REPORT56