General Motors 2012 Annual Report Download - page 154
Download and view the complete annual report
Please find page 154 of the 2012 General Motors annual report below. You can navigate through the pages in the report by either clicking on the pages listed below, or by using the keyword search tool below to find specific information within the annual report.-
 1
1 -
2
-
3
-
4
-
5
-
6
-
7
-
8
-
9
-
10
-
11
-
12
-
13
-
14
-
15
-
16
-
17
-
18
-
19
-
20
-
21
-
22
-
23
-
24
-
25
-
26
-
27
-
28
-
29
-
30
-
31
-
32
-
33
-
34
-
35
-
36
-
37
-
38
-
39
-
40
-
41
-
42
-
43
-
44
-
45
-
46
-
47
-
48
-
49
-
50
-
51
-
52
-
53
-
54
-
55
-
56
-
57
-
58
-
59
-
60
-
61
-
62
-
63
-
64
-
65
-
66
-
67
-
68
-
69
-
70
-
71
-
72
-
73
-
74
-
75
-
76
-
77
-
78
-
79
-
80
-
81
-
82
-
83
-
84
-
85
-
86
-
87
-
88
-
89
-
90
-
91
-
92
-
93
-
94
-
95
-
96
-
97
-
98
-
99
-
100
-
101
-
102
-
103
-
104
-
105
-
106
-
107
-
108
-
109
-
110
-
111
-
112
-
113
-
114
-
115
-
116
-
117
-
118
-
119
-
120
-
121
-
122
-
123
-
124
-
125
-
126
-
127
-
128
-
129
-
130
-
131
-
132
-
133
-
134
-
135
-
136
-
137
-
138
-
139
-
140
-
141
-
142
-
143
-
 144
144 -
 145
145 -
 146
146 -
 147
147 -
 148
148 -
 149
149 -
 150
150 -
 151
151 -
 152
152 -
 153
153 -
 154
154 -
 155
155 -
 156
156 -
 157
157 -
 158
158 -
 159
159 -
 160
160 -
 161
161 -
 162
162 -
 163
163 -
 164
164 -
165
-
166
-
167
-
168
-
169
-
170
-
171
-
172
-
173
-
174
-
175
-
176
-
177
-
178
-
179
-
180
-
181
-
182
 |
 |

GENERAL MOTORS COMPANY AND SUBSIDIARIES
NOTES TO CONSOLIDATED FINANCIAL STATEMENTS — (Continued)
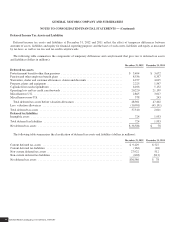
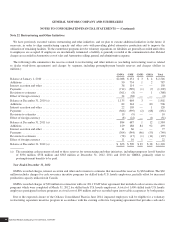
The following table summarizes the amount and expiration dates of our operating loss and tax credit carryforwards at December 31,
2012 (dollars in millions):
Expiration Dates Amounts
U.S. federal and state loss carryforwards ..................................................... 2013-2030 $ 6,642
Non-U.S. loss and tax credit carryforwards ................................................... Indefinite 1,472
Non-U.S. loss and tax credit carryforwards ................................................... 2013-2031 4,961
U.S. alternative minimum tax credit ......................................................... Indefinite 669
U.S. general business credits (a) ............................................................ 2017-2031 1,914
U.S. foreign tax credits ................................................................... 2013-2022 4,562
Total operating loss and tax credit carryforwards .............................................. $20,220
(a) The general business credits are principally composed of research credits.
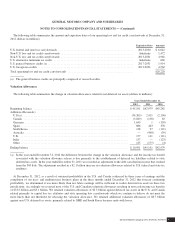
Valuation Allowances
The following table summarizes the change in valuation allowances related to net deferred tax assets (dollars in millions):
Years Ended December 31,
2012 2011 2010
Beginning balance .................................................................. $45,191 $42,979 $45,281
Additions (Reversals)
U.S.(a) .......................................................................... (34,263) 2,411 (2,196)
Canada ......................................................................... (3,049) (158) 63
Germany ........................................................................ 1,649 1 (139)
Spain ........................................................................... 886 463 378
South Korea ..................................................................... 138 27 (121)
Australia ........................................................................ — (498) (39)
U.K. ........................................................................... 177 141 (121)
India ........................................................................... 137 — (123)
Other ........................................................................... 125 (175) (4)
Ending balance ..................................................................... $10,991 $45,191 $42,979
(a) In the year ended December 31, 2012 the difference between the change in the valuation allowance and the income tax benefit
associated with the valuation allowance release is due primarily to the establishment of deferred tax liabilities related to state
deferred tax assets. In the year ended December 31, 2011 we recorded an adjustment to the debt cancellation income that resulted
from the 363 Sale. The adjustment resulted in a $2.1 billion increase in valuation allowances related to U.S. federal and state tax
attributes.
At December 31, 2012, as a result of sustained profitability in the U.S. and Canada evidenced by three years of earnings and the
completion of our near- and medium-term business plans in the three months ended December 31, 2012 that forecast continuing
profitability, we determined it was more likely than not future earnings will be sufficient to realize deferred tax assets in these two
jurisdictions. Accordingly we reversed most of the U.S. and Canadian valuation allowances resulting in non-cash income tax benefits
of $33.2 billion and $3.1 billion. We retained valuation allowances of $2.3 billion against deferred tax assets in the U.S. and Canada
related primarily to capital loss tax attributes and state operating loss carryforwards which we continue to believe do not meet the
more likely than not threshold for releasing the valuation allowance. We retained additional valuation allowances of $8.7 billion
against non-U.S. deferred tax assets, primarily related to GME and South Korea business units with losses.
General Motors Company 2012 ANNUAL REPORT 151