General Motors 2012 Annual Report Download - page 15
Download and view the complete annual report
Please find page 15 of the 2012 General Motors annual report below. You can navigate through the pages in the report by either clicking on the pages listed below, or by using the keyword search tool below to find specific information within the annual report.-
 1
1 -
2
-
3
-
4
-
 5
5 -
 6
6 -
 7
7 -
 8
8 -
 9
9 -
 10
10 -
 11
11 -
 12
12 -
 13
13 -
 14
14 -
 15
15 -
 16
16 -
 17
17 -
 18
18 -
 19
19 -
 20
20 -
 21
21 -
 22
22 -
 23
23 -
 24
24 -
 25
25 -
26
-
27
-
28
-
29
-
30
-
31
-
32
-
33
-
34
-
35
-
36
-
37
-
38
-
39
-
40
-
41
-
42
-
43
-
44
-
45
-
46
-
47
-
48
-
49
-
50
-
51
-
52
-
53
-
54
-
55
-
56
-
57
-
58
-
59
-
60
-
61
-
62
-
63
-
64
-
65
-
66
-
67
-
68
-
69
-
70
-
71
-
72
-
73
-
74
-
75
-
76
-
77
-
78
-
79
-
80
-
81
-
82
-
83
-
84
-
85
-
86
-
87
-
88
-
89
-
90
-
91
-
92
-
93
-
94
-
95
-
96
-
97
-
98
-
99
-
100
-
101
-
102
-
103
-
104
-
105
-
106
-
107
-
108
-
109
-
110
-
111
-
112
-
113
-
114
-
115
-
116
-
117
-
118
-
119
-
120
-
121
-
122
-
123
-
124
-
125
-
126
-
127
-
128
-
129
-
130
-
131
-
132
-
133
-
134
-
135
-
136
-
137
-
138
-
139
-
140
-
141
-
142
-
143
-
144
-
145
-
146
-
147
-
148
-
149
-
150
-
151
-
152
-
153
-
154
-
155
-
156
-
157
-
158
-
159
-
160
-
161
-
162
-
163
-
164
-
165
-
166
-
167
-
168
-
169
-
170
-
171
-
172
-
173
-
174
-
175
-
176
-
177
-
178
-
179
-
180
-
181
-
182
 |
 |

General Motors Company 2012 ANNUAL REPORT
12
NET INCOME ATTRIBUTABLE TO
COMMON STOCKHOLDERS (MILLIONS)
EARNINGS PER SHARE
FULLY DILUTED
$150.3
$152.3
REVENUE (BILLIONS)
2011
2012
COMPARISON OF CUMULATIVE
TOTAL RETURN
9/11 12/11 3/12 6/12 9/12 12/12
$050
$130
$120
$110
$100
$090
$080
$070
$060
9/11 12/11 3/12 6/12 9/12 12/12
General Motors
Company $ 59 $ 59 $ 75 $ 58 $ 67 $ 84
S&P 500 Index $ 96 $108 $121 $118 $125 $125
Ford $ 60 $ 67 $ 78 $ 60 $ 62 $ 82
Source: Standard & Poor’s Capital IQ
Notes: Assumes $100 invested on 11/18/10 in GM Common stock, in the S&P 500, and
in Ford, with reinvestment of dividends.
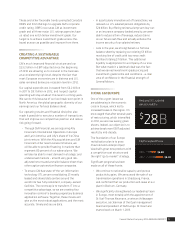
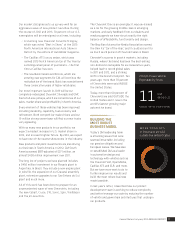
$4,8592012
$2.922012
vehicle sales
and net revenue
(in millions, except per share & units)
2011 2012
VEHICLE SALES, INCLUDING JOINT VENTURES - (OOO’S UNITS)
GMNA 2,925 3,019
GME 1,751 1,607
GMIO 3,281 3,616
GMSA 1,066 1,047
Worldwide Vehicle Sales 9,024 9,288
FINANCIAL RESULTS
Worldwide Net Sales & Revenue $150,276 $152,256
Earnings Before Interest and Income Taxes -
Adjusted* $ 8,304 $ 7,859
Net Income Attributable to Common
Stockholders $ 7,585 $ 4,859
Diluted Earnings Per Share $ 4.58 $ 2.92
AUTOMOTIVE LIQUIDITY & KEY OBLIGATIONS
Available Automotive Liquidity
Cash and Marketable Securities $ 31,647 $ 26,121
Credit Facilities 5,308 11,119
Total Available Automotive Liquidity $ 36,955 $ 37,240
Key Automotive Obligations
Debt $ 5,295 $ 5,172
Underfunded U.S. Pension 14,213 14,025
Total Key Automotive Obligations $ 19,508 $ 19,197
ADJUSTED AUTOMOTIVE FREE CASH FLOW
Operating Cash Flow $ 7,429 $ 9,631
Capital Expenditures (6,241) (8,055)
Automotive Free Cash Flow 1,188 1,576
Adjustments for Voluntary
Management Actions 1,830 2,712
Adjusted Automotive Free Cash Flow $ 3,018 $ 4,288
EMPLOYMENT - YEAR END (000’S)
GMNA 98 101
GME 39 37
GMIO 34 39
GMSA 33 32
GM Financial 3 4
Worldwide Employment 207 213
*Includes GM Financial on an Earnings Before Tax (EBT) basis
General Motors Company 2012 ANNUAL REPORT
12