General Motors 2012 Annual Report Download - page 68
Download and view the complete annual report
Please find page 68 of the 2012 General Motors annual report below. You can navigate through the pages in the report by either clicking on the pages listed below, or by using the keyword search tool below to find specific information within the annual report.-
 1
1 -
2
-
3
-
4
-
5
-
6
-
7
-
8
-
9
-
10
-
11
-
12
-
13
-
14
-
15
-
16
-
17
-
18
-
19
-
20
-
21
-
22
-
23
-
24
-
25
-
26
-
27
-
28
-
29
-
30
-
31
-
32
-
33
-
34
-
35
-
36
-
37
-
38
-
39
-
40
-
41
-
42
-
43
-
44
-
45
-
46
-
47
-
48
-
49
-
50
-
51
-
52
-
53
-
54
-
55
-
56
-
57
-
 58
58 -
 59
59 -
 60
60 -
 61
61 -
 62
62 -
 63
63 -
 64
64 -
 65
65 -
 66
66 -
 67
67 -
 68
68 -
 69
69 -
 70
70 -
 71
71 -
 72
72 -
 73
73 -
 74
74 -
 75
75 -
 76
76 -
 77
77 -
 78
78 -
79
-
80
-
81
-
82
-
83
-
84
-
85
-
86
-
87
-
88
-
89
-
90
-
91
-
92
-
93
-
94
-
95
-
96
-
97
-
98
-
99
-
100
-
101
-
102
-
103
-
104
-
105
-
106
-
107
-
108
-
109
-
110
-
111
-
112
-
113
-
114
-
115
-
116
-
117
-
118
-
119
-
120
-
121
-
122
-
123
-
124
-
125
-
126
-
127
-
128
-
129
-
130
-
131
-
132
-
133
-
134
-
135
-
136
-
137
-
138
-
139
-
140
-
141
-
142
-
143
-
144
-
145
-
146
-
147
-
148
-
149
-
150
-
151
-
152
-
153
-
154
-
155
-
156
-
157
-
158
-
159
-
160
-
161
-
162
-
163
-
164
-
165
-
166
-
167
-
168
-
169
-
170
-
171
-
172
-
173
-
174
-
175
-
176
-
177
-
178
-
179
-
180
-
181
-
182
 |
 |

GENERAL MOTORS COMPANY AND SUBSIDIARIES
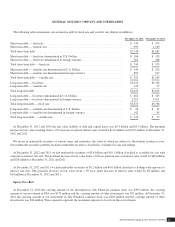
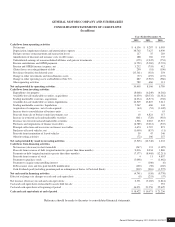
The following table summarizes our automotive debt by fixed rate and variable rate (dollars in millions):
December 31, 2012 December 31, 2011
Short-term debt — fixed rate ...................................................... $ 749 $ 573
Short-term debt — variable rate .................................................... 999 1,109
Total short-term debt ............................................................. $1,748 $1,682
Short-term debt — fixed rate denominated in U.S. Dollars ............................... $ 186 $ 135
Short-term debt — fixed rate denominated in foreign currency ............................ 563 438
Total short-term debt — fixed rate .................................................. $ 749 $ 573
Short-term debt — variable rate denominated in U.S. Dollars ............................. $ 140 $ 192
Short-term debt — variable rate denominated in foreign currency ......................... 859 917
Total short-term debt — variable rate ................................................ $ 999 $1,109
Long-term debt — fixed rate ...................................................... $3,254 $3,536
Long-term debt — variable rate .................................................... 170 77
Total long-term debt ............................................................. $3,424 $3,613
Long-term debt — fixed rate denominated in U.S. Dollars ............................... $ 663 $ 525
Long-term debt — fixed rate denominated in foreign currency ............................ 2,591 3,011
Total long-term debt — fixed rate .................................................. $3,254 $3,536
Long-term debt — variable rate denominated in U.S. Dollars ............................. $ 28 $ 32
Long-term debt — variable rate denominated in foreign currency ......................... 142 45
Total long-term debt — variable rate ................................................ $ 170 $ 77
At December 31, 2012 and 2011 the fair value liability of debt and capital leases was $5.3 billion and $5.5 billion. The potential
increase in fair value resulting from a 10% decrease in quoted interest rates would be $112 million and $152 million at December 31,
2012 and 2011.
We invest in marketable securities of various types and maturities, the value of which are subject to fluctuations in interest rates.
Our marketable securities portfolio includes marketable securities classified as available-for-sale and trading.
At December 31, 2012 and 2011 we had marketable securities of $3.8 billion and $10.1 billion classified as available-for sale with
exposure to interest rate risk. The potential decrease in fair value from a 50 basis point increase in interest rates would be $28 million
and $28 million at December 31, 2012 and 2011.
At December 31, 2012 and 2011 we had marketable securities of $5.2 billion and $6.0 billion classified as trading with exposure to
interest rate risk. The potential decrease in fair value from a 50 basis point increase in interest rates would be $8 million and
$20 million at December 31, 2012 and 2011.
Equity Price Risk
At December 31, 2012 the carrying amount of our investment in Ally Financial common stock was $399 million, the carrying
amount of our investment in PSA was $179 million and the carrying amount of other investments was $21 million. At December 31,
2011 the carrying amount of our investment in Ally Financial common stock was $403 million and the carrying amount of other
investments was $36 million. These amounts represent the maximum exposure to loss from these investments.
General Motors Company 2012 ANNUAL REPORT 65