General Motors 2012 Annual Report Download - page 169
Download and view the complete annual report
Please find page 169 of the 2012 General Motors annual report below. You can navigate through the pages in the report by either clicking on the pages listed below, or by using the keyword search tool below to find specific information within the annual report.-
 1
1 -
2
-
3
-
4
-
5
-
6
-
7
-
8
-
9
-
10
-
11
-
12
-
13
-
14
-
15
-
16
-
17
-
18
-
19
-
20
-
21
-
22
-
23
-
24
-
25
-
26
-
27
-
28
-
29
-
30
-
31
-
32
-
33
-
34
-
35
-
36
-
37
-
38
-
39
-
40
-
41
-
42
-
43
-
44
-
45
-
46
-
47
-
48
-
49
-
50
-
51
-
52
-
53
-
54
-
55
-
56
-
57
-
58
-
59
-
60
-
61
-
62
-
63
-
64
-
65
-
66
-
67
-
68
-
69
-
70
-
71
-
72
-
73
-
74
-
75
-
76
-
77
-
78
-
79
-
80
-
81
-
82
-
83
-
84
-
85
-
86
-
87
-
88
-
89
-
90
-
91
-
92
-
93
-
94
-
95
-
96
-
97
-
98
-
99
-
100
-
101
-
102
-
103
-
104
-
105
-
106
-
107
-
108
-
109
-
110
-
111
-
112
-
113
-
114
-
115
-
116
-
117
-
118
-
119
-
120
-
121
-
122
-
123
-
124
-
125
-
126
-
127
-
128
-
129
-
130
-
131
-
132
-
133
-
134
-
135
-
136
-
137
-
138
-
139
-
140
-
141
-
142
-
143
-
144
-
145
-
146
-
147
-
148
-
149
-
150
-
151
-
152
-
153
-
154
-
155
-
156
-
157
-
158
-
 159
159 -
 160
160 -
 161
161 -
 162
162 -
 163
163 -
 164
164 -
 165
165 -
 166
166 -
 167
167 -
 168
168 -
 169
169 -
 170
170 -
 171
171 -
 172
172 -
 173
173 -
 174
174 -
 175
175 -
 176
176 -
 177
177 -
 178
178 -
 179
179 -
180
-
181
-
182
 |
 |

GENERAL MOTORS COMPANY AND SUBSIDIARIES
NOTES TO CONSOLIDATED FINANCIAL STATEMENTS — (Continued)
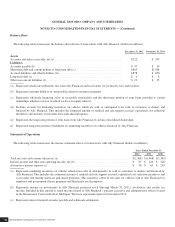
Balance Sheet
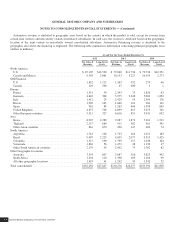
The following table summarizes the balance sheet effects of transactions with Ally Financial (dollars in millions):
December 31, 2012 December 31, 2011
Assets
Accounts and notes receivable, net (a) ............................................... $222 $ 243
Liabilities
Accounts payable (b) ............................................................. $ 47 $ 59
Short-term debt and current portion of long-term debt (c) ................................ $863 $1,068
Accrued liabilities and other liabilities (d) ............................................ $878 $ 650
Long-term debt (e) .............................................................. $ 6 $ 8
Other non-current liabilities (f) ..................................................... $ 19 $ 35
(a) Represents wholesale settlements due from Ally Financial and receivables for exclusivity fees and royalties.
(b) Represents amounts billed to us and payable related to incentive programs.
(c) Represents wholesale financing, sales of receivable transactions and the short-term portion of term loans provided to certain
dealerships which we own or in which we have an equity interest.
(d) Includes accruals for marketing incentives on vehicles which are sold, or anticipated to be sold, to customers or dealers and
financed by Ally Financial. This includes the estimated amount of residual and rate support accrued, capitalized cost reduction
incentives and amounts owed under lease pull-ahead programs.
(e) Represents the long-term portion of term loans from Ally Financial to certain consolidated dealerships.
(f) Represents long-term portion of liabilities for marketing incentives on vehicles financed by Ally Financial.
Statement of Operations
The following table summarizes the income statement effects of transactions with Ally Financial (dollars in millions):
Years Ended December 31,
2012 2011 2010
Total net sales and revenue (decrease) (a) .................................................. $(2,368) $(1,468) $(1,383)
Interest income and other non-operating income, net (b) ...................................... $ 87 $ 126 $ 228
Automotive interest expense (c) ......................................................... $ 38 $ 63 $ 243
(a) Represents marketing incentives on vehicles which were sold, or anticipated to be sold, to customers or dealers and financed by
Ally Financial. This includes the estimated amount of residual and rate support accrued, capitalized cost reduction incentives and
costs under risk sharing and lease pull-ahead programs. This amount is offset by net sales for vehicles sold to Ally Financial for
employee and governmental lease programs and third-party resale purposes.
(b) Represents income on investments in Ally Financial preferred stock (through March 31, 2011), exclusivity and royalty fee
income. Included in this amount is rental income related to Ally Financial’s primary executive and administrative offices located
in the Renaissance Center in Detroit, Michigan. The lease agreement expires in November 2016.
(c) Represents interest incurred on notes payable and wholesale settlements.
General Motors Company 2012 ANNUAL REPORT166