General Motors 2012 Annual Report Download - page 153
Download and view the complete annual report
Please find page 153 of the 2012 General Motors annual report below. You can navigate through the pages in the report by either clicking on the pages listed below, or by using the keyword search tool below to find specific information within the annual report.-
 1
1 -
2
-
3
-
4
-
5
-
6
-
7
-
8
-
9
-
10
-
11
-
12
-
13
-
14
-
15
-
16
-
17
-
18
-
19
-
20
-
21
-
22
-
23
-
24
-
25
-
26
-
27
-
28
-
29
-
30
-
31
-
32
-
33
-
34
-
35
-
36
-
37
-
38
-
39
-
40
-
41
-
42
-
43
-
44
-
45
-
46
-
47
-
48
-
49
-
50
-
51
-
52
-
53
-
54
-
55
-
56
-
57
-
58
-
59
-
60
-
61
-
62
-
63
-
64
-
65
-
66
-
67
-
68
-
69
-
70
-
71
-
72
-
73
-
74
-
75
-
76
-
77
-
78
-
79
-
80
-
81
-
82
-
83
-
84
-
85
-
86
-
87
-
88
-
89
-
90
-
91
-
92
-
93
-
94
-
95
-
96
-
97
-
98
-
99
-
100
-
101
-
102
-
103
-
104
-
105
-
106
-
107
-
108
-
109
-
110
-
111
-
112
-
113
-
114
-
115
-
116
-
117
-
118
-
119
-
120
-
121
-
122
-
123
-
124
-
125
-
126
-
127
-
128
-
129
-
130
-
131
-
132
-
133
-
134
-
135
-
136
-
137
-
138
-
139
-
140
-
141
-
142
-
 143
143 -
 144
144 -
 145
145 -
 146
146 -
 147
147 -
 148
148 -
 149
149 -
 150
150 -
 151
151 -
 152
152 -
 153
153 -
 154
154 -
 155
155 -
 156
156 -
 157
157 -
 158
158 -
 159
159 -
 160
160 -
 161
161 -
 162
162 -
 163
163 -
164
-
165
-
166
-
167
-
168
-
169
-
170
-
171
-
172
-
173
-
174
-
175
-
176
-
177
-
178
-
179
-
180
-
181
-
182
 |
 |

GENERAL MOTORS COMPANY AND SUBSIDIARIES
NOTES TO CONSOLIDATED FINANCIAL STATEMENTS — (Continued)
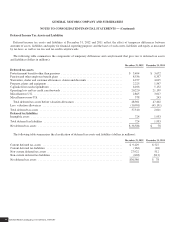
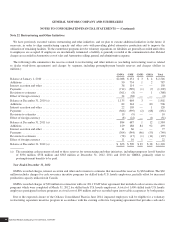
Deferred Income Tax Assets and Liabilities
Deferred income tax assets and liabilities at December 31, 2012 and 2011 reflect the effect of temporary differences between
amounts of assets, liabilities and equity for financial reporting purposes and the bases of such assets, liabilities and equity as measured
by tax laws, as well as tax loss and tax credit carryforwards.
The following table summarizes the components of temporary differences and carryforwards that give rise to deferred tax assets
and liabilities (dollars in millions):
December 31, 2012 December 31, 2011
Deferred tax assets
Postretirement benefits other than pensions ........................................... $ 3,494 $ 3,672
Pension and other employee benefit plans ............................................ 8,536 8,357
Warranties, dealer and customer allowances, claims and discounts ......................... 4,277 4,015
Property, plants and equipment ..................................................... 2,225 1,547
Capitalized research expenditures ................................................... 6,106 5,152
Operating loss and tax credit carryforwards ........................................... 20,220 21,199
Miscellaneous U.S. .............................................................. 2,865 3,017
Miscellaneous non-U.S. .......................................................... 578 243
Total deferred tax assets before valuation allowances ................................. 48,301 47,202
Less: valuation allowances ........................................................ (10,991) (45,191)
Total deferred tax assets .......................................................... 37,310 2,011
Deferred tax liabilities
Intangible assets ................................................................ 724 1,933
Total deferred tax liabilities ....................................................... 724 1,933
Net deferred tax assets ........................................................... $36,586 $ 78
The following table summarizes the classification of deferred tax assets and liabilities (dollars in millions):
December 31, 2012 December 31, 2011
Current deferred tax assets ........................................................ $ 9,429 $ 527
Current deferred tax liabilities ..................................................... (162) (48)
Non-current deferred tax assets ..................................................... 27,922 512
Non-current deferred tax liabilities .................................................. (603) (913)
Net deferred tax assets ........................................................... $36,586 $ 78
General Motors Company 2012 ANNUAL REPORT150