General Motors 2012 Annual Report Download - page 36
Download and view the complete annual report
Please find page 36 of the 2012 General Motors annual report below. You can navigate through the pages in the report by either clicking on the pages listed below, or by using the keyword search tool below to find specific information within the annual report.-
 1
1 -
2
-
3
-
4
-
5
-
6
-
7
-
8
-
9
-
10
-
11
-
12
-
13
-
14
-
15
-
16
-
17
-
18
-
19
-
20
-
21
-
22
-
23
-
24
-
25
-
 26
26 -
 27
27 -
 28
28 -
 29
29 -
 30
30 -
 31
31 -
 32
32 -
 33
33 -
 34
34 -
 35
35 -
 36
36 -
 37
37 -
 38
38 -
 39
39 -
 40
40 -
 41
41 -
 42
42 -
 43
43 -
 44
44 -
 45
45 -
 46
46 -
47
-
48
-
49
-
50
-
51
-
52
-
53
-
54
-
55
-
56
-
57
-
58
-
59
-
60
-
61
-
62
-
63
-
64
-
65
-
66
-
67
-
68
-
69
-
70
-
71
-
72
-
73
-
74
-
75
-
76
-
77
-
78
-
79
-
80
-
81
-
82
-
83
-
84
-
85
-
86
-
87
-
88
-
89
-
90
-
91
-
92
-
93
-
94
-
95
-
96
-
97
-
98
-
99
-
100
-
101
-
102
-
103
-
104
-
105
-
106
-
107
-
108
-
109
-
110
-
111
-
112
-
113
-
114
-
115
-
116
-
117
-
118
-
119
-
120
-
121
-
122
-
123
-
124
-
125
-
126
-
127
-
128
-
129
-
130
-
131
-
132
-
133
-
134
-
135
-
136
-
137
-
138
-
139
-
140
-
141
-
142
-
143
-
144
-
145
-
146
-
147
-
148
-
149
-
150
-
151
-
152
-
153
-
154
-
155
-
156
-
157
-
158
-
159
-
160
-
161
-
162
-
163
-
164
-
165
-
166
-
167
-
168
-
169
-
170
-
171
-
172
-
173
-
174
-
175
-
176
-
177
-
178
-
179
-
180
-
181
-
182
 |
 |

GENERAL MOTORS COMPANY AND SUBSIDIARIES
In the year ended December 31, 2011 income tax benefit of $0.1 billion decreased by $0.8 billion compared to income tax expense
of $0.7 billion in 2010 due primarily to: (1) a $0.5 billion valuation allowance reversal in Australia; and (2) an increase in recognition
of previously unrecognized tax benefits of $0.2 billion which included reductions to interest expense and associated valuation
allowances.
Refer to Note 21 to our consolidated financial statements for additional information related to our income tax expense (benefit).
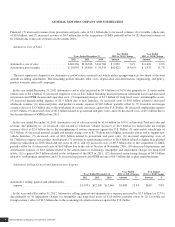
Equity Income, Net of Tax and Gain on Investments
Years Ended December 31,
Year Ended
2012 vs. 2011 Change
Year Ended
2011 vs. 2010 Change
2012 2011 2010 Amount % Amount %
China JVs ......................................... $1,521 $1,511 $1,297 $ 10 0.7% $ 214 16.5%
New Delphi (including gain on disposition) .............. — 1,727 117 (1,727) n.m. 1,610 n.m.
Others ............................................ 41 (46) 24 87 n.m. (70) n.m.
Total equity income, net of tax and gain on investments ..... $1,562 $3,192 $1,438 $(1,630) (51.1)% $1,754 122.0%
n.m. = not meaningful
In the year ended December 31, 2012 Equity income, net of tax and gain on investments decreased by $1.6 billion (or 51.1%) due
primarily to: (1) a $1.6 billion gain related to the sale of our New Delphi Class A Membership Interests and related equity income for
the year ended December 31, 2011 that did not recur for the year ended December 31, 2012. Income from our China JVs increased
slightly.
In the year ended December 31, 2011 Equity income, net of tax and gain on investments increased by $1.8 billion (or 122.0%) due
primarily to a gain of $1.6 billion related to the sale of our New Delphi Class A Membership Interests and increased equity income
related to our China JVs of $0.2 billion.
General Motors Company 2012 ANNUAL REPORT 33