General Motors 2012 Annual Report Download - page 163
Download and view the complete annual report
Please find page 163 of the 2012 General Motors annual report below. You can navigate through the pages in the report by either clicking on the pages listed below, or by using the keyword search tool below to find specific information within the annual report.-
 1
1 -
2
-
3
-
4
-
5
-
6
-
7
-
8
-
9
-
10
-
11
-
12
-
13
-
14
-
15
-
16
-
17
-
18
-
19
-
20
-
21
-
22
-
23
-
24
-
25
-
26
-
27
-
28
-
29
-
30
-
31
-
32
-
33
-
34
-
35
-
36
-
37
-
38
-
39
-
40
-
41
-
42
-
43
-
44
-
45
-
46
-
47
-
48
-
49
-
50
-
51
-
52
-
53
-
54
-
55
-
56
-
57
-
58
-
59
-
60
-
61
-
62
-
63
-
64
-
65
-
66
-
67
-
68
-
69
-
70
-
71
-
72
-
73
-
74
-
75
-
76
-
77
-
78
-
79
-
80
-
81
-
82
-
83
-
84
-
85
-
86
-
87
-
88
-
89
-
90
-
91
-
92
-
93
-
94
-
95
-
96
-
97
-
98
-
99
-
100
-
101
-
102
-
103
-
104
-
105
-
106
-
107
-
108
-
109
-
110
-
111
-
112
-
113
-
114
-
115
-
116
-
117
-
118
-
119
-
120
-
121
-
122
-
123
-
124
-
125
-
126
-
127
-
128
-
129
-
130
-
131
-
132
-
133
-
134
-
135
-
136
-
137
-
138
-
139
-
140
-
141
-
142
-
143
-
144
-
145
-
146
-
147
-
148
-
149
-
150
-
151
-
152
-
 153
153 -
 154
154 -
 155
155 -
 156
156 -
 157
157 -
 158
158 -
 159
159 -
 160
160 -
 161
161 -
 162
162 -
 163
163 -
 164
164 -
 165
165 -
 166
166 -
 167
167 -
 168
168 -
 169
169 -
 170
170 -
 171
171 -
 172
172 -
 173
173 -
174
-
175
-
176
-
177
-
178
-
179
-
180
-
181
-
182
 |
 |

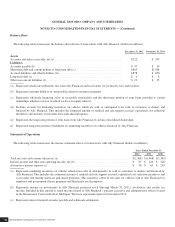
GENERAL MOTORS COMPANY AND SUBSIDIARIES
NOTES TO CONSOLIDATED FINANCIAL STATEMENTS — (Continued)
Other Comprehensive Income (Loss)
The following tables summarize the components of Other comprehensive income (loss) attributable to common stockholders
(dollars in millions):
Years Ended December 31,
2012 2011 2010
Pre-tax
Amount
Tax
Expense
(Benefit)
Net
Amount
Pre-tax
Amount
Tax
Expense
(Benefit)
Net
Amount
Pre-tax
Amount
Tax
Expense
(Benefit)
Net
Amount
Foreign currency translation adjustments ............ $ (103) $ — $ (103) $ (183) $ — $ (183) $ 210 $— $ 210
Cash flow hedging gain (loss), net ................. (2) — (2) 25 — 25 (22) — (22)
Unrealized gain (loss) on securities, net .............
Unrealized gain (loss) on securities .............. (140) 22 (162) 1 — 1 (7) — (7)
Reclassification adjustments .................... 202 (5) 207 — — — — — —
Unrealized gain (loss) on securities, net ........... 62 17 45 1 — 1 (7) — (7)
Defined benefit plans, net ........................
Prior service benefit (cost) from plan amendments . . (53) (95) 42 302 1 301 7 1 6
Less: amortization of prior service cost included in
net periodic benefit cost ..................... (125) (5) (120) (52) — (52) (12) — (12)
Net prior service benefit (cost) .................. (178) (100) (78) 250 1 249 (5) 1 (6)
Actuarial gain (loss) from plan measurements ...... (3,180) (926) (2,254) (7,578) (10) (7,568) (530) 34 (564)
Less: amortization of actuarial loss included in net
periodic benefit cost (a) ..................... 229 17 212 366 5 361 25 — 25
Net actuarial amounts ......................... (2,951) (909) (2,042) (7,212) (5) (7,207) (505) 34 (539)
Defined benefit plans, net ...................... (3,129) (1,009) (2,120) (6,962) (4) (6,958) (510) 35 (545)
Other comprehensive income (loss) ................ (3,172) (992) (2,180) (7,119) (4) (7,115) (329) 35 (364)
Less: other comprehensive income (loss) attributable
to noncontrolling interests .................... 11 — 11 (10) — (10) (13) — (13)
Other comprehensive income (loss) attributable to
common stockholders ......................... $(3,183) $ (992) $(2,191) $(7,109) $ (4) $(7,105) $(316) $35 $(351)
(a) Includes the HCT settlement. Refer to Note 18.
Note 25. Earnings Per Share
In the years ended December 31, 2012 and 2011 we were required to use the two-class method for calculating earnings per share, as
further discussed below, as the applicable market value of our common stock was below $33.00 per common share in the periods
ended December 31, 2012 and 2011.
Basic and diluted earnings per share are computed by dividing Net income attributable to common stockholders by the weighted-
average common shares outstanding in the period. Diluted earnings per share is computed by giving effect to all potentially dilutive
securities that were outstanding.
General Motors Company 2012 ANNUAL REPORT160