General Motors 2012 Annual Report Download - page 103
Download and view the complete annual report
Please find page 103 of the 2012 General Motors annual report below. You can navigate through the pages in the report by either clicking on the pages listed below, or by using the keyword search tool below to find specific information within the annual report.-
 1
1 -
2
-
3
-
4
-
5
-
6
-
7
-
8
-
9
-
10
-
11
-
12
-
13
-
14
-
15
-
16
-
17
-
18
-
19
-
20
-
21
-
22
-
23
-
24
-
25
-
26
-
27
-
28
-
29
-
30
-
31
-
32
-
33
-
34
-
35
-
36
-
37
-
38
-
39
-
40
-
41
-
42
-
43
-
44
-
45
-
46
-
47
-
48
-
49
-
50
-
51
-
52
-
53
-
54
-
55
-
56
-
57
-
58
-
59
-
60
-
61
-
62
-
63
-
64
-
65
-
66
-
67
-
68
-
69
-
70
-
71
-
72
-
73
-
74
-
75
-
76
-
77
-
78
-
79
-
80
-
81
-
82
-
83
-
84
-
85
-
86
-
87
-
88
-
89
-
90
-
91
-
92
-
 93
93 -
 94
94 -
 95
95 -
 96
96 -
 97
97 -
 98
98 -
 99
99 -
 100
100 -
 101
101 -
 102
102 -
 103
103 -
 104
104 -
 105
105 -
 106
106 -
 107
107 -
 108
108 -
 109
109 -
 110
110 -
 111
111 -
 112
112 -
 113
113 -
114
-
115
-
116
-
117
-
118
-
119
-
120
-
121
-
122
-
123
-
124
-
125
-
126
-
127
-
128
-
129
-
130
-
131
-
132
-
133
-
134
-
135
-
136
-
137
-
138
-
139
-
140
-
141
-
142
-
143
-
144
-
145
-
146
-
147
-
148
-
149
-
150
-
151
-
152
-
153
-
154
-
155
-
156
-
157
-
158
-
159
-
160
-
161
-
162
-
163
-
164
-
165
-
166
-
167
-
168
-
169
-
170
-
171
-
172
-
173
-
174
-
175
-
176
-
177
-
178
-
179
-
180
-
181
-
182
 |
 |

GENERAL MOTORS COMPANY AND SUBSIDIARIES
NOTES TO CONSOLIDATED FINANCIAL STATEMENTS — (Continued)
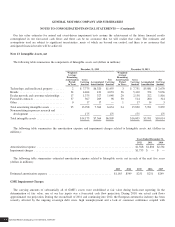
The following table summarizes equipment on operating leases to daily rental car companies measured at fair value utilizing Level
3 inputs on a nonrecurring basis (dollars in millions):
Fair Value Measurements on a Nonrecurring Basis (a)
Fair Value Measures Level 1 Level 2 Level 3
Year ended December 31, 2012 ......................... $2,469 $— $— $2,469
Year ended December 31, 2011 ......................... $2,571 $— $— $2,571
Year ended December 31, 2010 ......................... $2,310 $— $— $2,310
(a) The carrying amount of the related assets at December 31, 2012, 2011 and 2010 may no longer equal the fair value as the fair
value presented is as of the date the impairment was recorded during the year presented.
Impairment of vehicles leased to daily rental car companies with guaranteed repurchase obligations is determined to exist if the
expected future cash flows are lower than the carrying amount of the vehicle. We have multiple, distinct portfolios of vehicles leased
to rental car companies and may have multiple impairments within a period. Expected cash flows include all estimated net revenue
and costs associated with the sale to daily rental car companies through disposal at auction. The fair value measurements are
determined, reviewed and approved on a monthly basis by personnel with appropriate knowledge of transactions with daily rental car
companies and auction transactions.
The following table summarizes the significant quantitative unobservable inputs and assumptions used in the fair value
measurement of Equipment on operating leases, net (dollars in millions):
Valuation
Technique
Significant
Unobservable Input
Year Ended
December 31, 2012
Impaired equipment on operating leases ............................... Cash flow Estimated net revenue $2,530
Estimated costs $2,711
Automotive Financing — GM Financial
GM Financial originates leases in the U.S. and Canada that are recorded as operating leases. A Canadian subsidiary of GM
Financial originates and sells leases to a third-party with servicing retained.
The following table summarizes GM Financial equipment on operating leases, net (dollars in millions):
December 31, 2012 December 31, 2011
GM Financial equipment on operating leases .......................................... $1,910 $860
Less: accumulated depreciation .................................................... (261) (75)
GM Financial equipment on operating leases, net ...................................... $1,649 $785
The following table summarizes depreciation expense related to GM Financial equipment on operating leases, net (dollars in
millions):
Year Ended December 31,
2012 2011
Depreciation expense ....................................................................... $205 $70
General Motors Company 2012 ANNUAL REPORT100