General Motors 2012 Annual Report Download - page 135
Download and view the complete annual report
Please find page 135 of the 2012 General Motors annual report below. You can navigate through the pages in the report by either clicking on the pages listed below, or by using the keyword search tool below to find specific information within the annual report.-
 1
1 -
2
-
3
-
4
-
5
-
6
-
7
-
8
-
9
-
10
-
11
-
12
-
13
-
14
-
15
-
16
-
17
-
18
-
19
-
20
-
21
-
22
-
23
-
24
-
25
-
26
-
27
-
28
-
29
-
30
-
31
-
32
-
33
-
34
-
35
-
36
-
37
-
38
-
39
-
40
-
41
-
42
-
43
-
44
-
45
-
46
-
47
-
48
-
49
-
50
-
51
-
52
-
53
-
54
-
55
-
56
-
57
-
58
-
59
-
60
-
61
-
62
-
63
-
64
-
65
-
66
-
67
-
68
-
69
-
70
-
71
-
72
-
73
-
74
-
75
-
76
-
77
-
78
-
79
-
80
-
81
-
82
-
83
-
84
-
85
-
86
-
87
-
88
-
89
-
90
-
91
-
92
-
93
-
94
-
95
-
96
-
97
-
98
-
99
-
100
-
101
-
102
-
103
-
104
-
105
-
106
-
107
-
108
-
109
-
110
-
111
-
112
-
113
-
114
-
115
-
116
-
117
-
118
-
119
-
120
-
121
-
122
-
123
-
124
-
 125
125 -
 126
126 -
 127
127 -
 128
128 -
 129
129 -
 130
130 -
 131
131 -
 132
132 -
 133
133 -
 134
134 -
 135
135 -
 136
136 -
 137
137 -
 138
138 -
 139
139 -
 140
140 -
 141
141 -
 142
142 -
 143
143 -
 144
144 -
 145
145 -
146
-
147
-
148
-
149
-
150
-
151
-
152
-
153
-
154
-
155
-
156
-
157
-
158
-
159
-
160
-
161
-
162
-
163
-
164
-
165
-
166
-
167
-
168
-
169
-
170
-
171
-
172
-
173
-
174
-
175
-
176
-
177
-
178
-
179
-
180
-
181
-
182
 |
 |

GENERAL MOTORS COMPANY AND SUBSIDIARIES
NOTES TO CONSOLIDATED FINANCIAL STATEMENTS — (Continued)
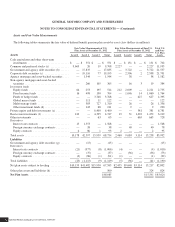
Assets and Fair Value Measurements
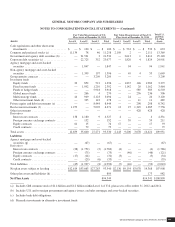
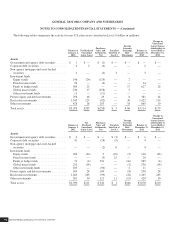
The following tables summarize the fair value of defined benefit pension plan assets by asset class (dollars in millions):
Fair Value Measurements of U.S.
Plan Assets at December 31, 2012
Fair Value Measurements of Non-U.S.
Plan Assets at December 31, 2012
Total U.S.
and Non-
U.S. Plan
AssetsAssets Level 1 Level 2 Level 3 Total Level 1 Level 2 Level 3 Total
Cash equivalents and other short-term
investments ............................. $ — $ 551 $ — $ 551 $ — $ 151 $ — $ 151 $ 702
Common and preferred stocks (a) ............. 9,663 26 19 9,708 2,227 — — 2,227 11,935
Government and agency debt securities (b) ...... — 17,835 — 17,835 — 3,722 — 3,722 21,557
Corporate debt securities (c) ................. — 19,116 77 19,193 — 2,596 2 2,598 21,791
Agency mortgage and asset-backed securities .... — 1,544 — 1,544 — 38 — 38 1,582
Non-agency mortgage and asset-backed
securities ............................... — 260 105 365 — 16 3 19 384
Investment funds
Equity funds ............................ 66 253 195 514 212 2,009 — 2,221 2,735
Fixed income funds ...................... 16 498 190 704 — 1,046 14 1,060 1,764
Funds of hedge funds ..................... — — 3,768 3,768 — — 627 627 4,395
Global macro funds ...................... — 111 11 122——— —122
Multi-strategy funds ...................... — 583 727 1,310 — 26 — 26 1,336
Other investment funds (d) ................. — 143 68 211 — 9 — 9 220
Private equity and debt investments (e) ......... — — 6,400 6,400 — — 381 381 6,781
Real estate investments (f) ................... 412 — 4,335 4,747 19 31 1,422 1,472 6,219
Other investments .......................... — — 63 63 — — 665 665 728
Derivatives
Interest rate contracts ..................... 15 1,553 — 1,568——— —1,568
Foreign currency exchange contracts ......... — 38 — 38 — 40 — 40 78
Equity contracts ......................... 6 86 1 93 2 — — 2 95
Total assets ............................... 10,178 42,597 15,959 68,734 2,460 9,684 3,114 15,258 83,992
Liabilities
Government and agency debt securities (g) ...... — (15) — (15) — — — — (15)
Derivatives
Interest rate contracts ..................... (21) (977) (8) (1,006) (4) — — (4) (1,010)
Foreign currency exchange contracts ......... — (37) — (37) — (36) — (36) (73)
Equity contracts ......................... (4) (86) (1) (91) (1) — — (1) (92)
Total liabilities ............................ (25) (1,115) (9) (1,149) (5) (36) — (41) (1,190)
Net plan assets subject to leveling ............. $10,153 $41,482 $15,950 67,585 $2,455 $9,648 $3,114 15,217 82,802
Other plan assets and liabilities (h) ............ 500 324 824
Net Plan Assets ............................. $68,085 $ 15,541 $ 83,626
General Motors Company 2012 ANNUAL REPORT132