General Motors 2012 Annual Report Download - page 129
Download and view the complete annual report
Please find page 129 of the 2012 General Motors annual report below. You can navigate through the pages in the report by either clicking on the pages listed below, or by using the keyword search tool below to find specific information within the annual report.-
 1
1 -
2
-
3
-
4
-
5
-
6
-
7
-
8
-
9
-
10
-
11
-
12
-
13
-
14
-
15
-
16
-
17
-
18
-
19
-
20
-
21
-
22
-
23
-
24
-
25
-
26
-
27
-
28
-
29
-
30
-
31
-
32
-
33
-
34
-
35
-
36
-
37
-
38
-
39
-
40
-
41
-
42
-
43
-
44
-
45
-
46
-
47
-
48
-
49
-
50
-
51
-
52
-
53
-
54
-
55
-
56
-
57
-
58
-
59
-
60
-
61
-
62
-
63
-
64
-
65
-
66
-
67
-
68
-
69
-
70
-
71
-
72
-
73
-
74
-
75
-
76
-
77
-
78
-
79
-
80
-
81
-
82
-
83
-
84
-
85
-
86
-
87
-
88
-
89
-
90
-
91
-
92
-
93
-
94
-
95
-
96
-
97
-
98
-
99
-
100
-
101
-
102
-
103
-
104
-
105
-
106
-
107
-
108
-
109
-
110
-
111
-
112
-
113
-
114
-
115
-
116
-
117
-
118
-
 119
119 -
 120
120 -
 121
121 -
 122
122 -
 123
123 -
 124
124 -
 125
125 -
 126
126 -
 127
127 -
 128
128 -
 129
129 -
 130
130 -
 131
131 -
 132
132 -
 133
133 -
 134
134 -
 135
135 -
 136
136 -
 137
137 -
 138
138 -
 139
139 -
140
-
141
-
142
-
143
-
144
-
145
-
146
-
147
-
148
-
149
-
150
-
151
-
152
-
153
-
154
-
155
-
156
-
157
-
158
-
159
-
160
-
161
-
162
-
163
-
164
-
165
-
166
-
167
-
168
-
169
-
170
-
171
-
172
-
173
-
174
-
175
-
176
-
177
-
178
-
179
-
180
-
181
-
182
 |
 |

GENERAL MOTORS COMPANY AND SUBSIDIARIES
NOTES TO CONSOLIDATED FINANCIAL STATEMENTS — (Continued)
In March 2011 certain pension plans in GME were remeasured as part of our Goodwill impairment testing, resulting in a decrease
of $272 million in the pension liability and a pre-tax increase in the net actuarial gain component of Accumulated other
comprehensive loss.
Refer to Note 12 for additional information on our Goodwill impairment.
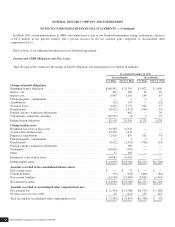
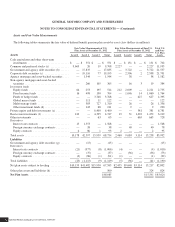
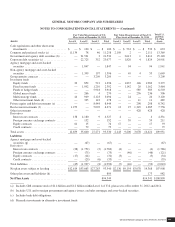
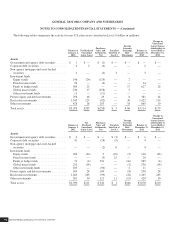
Pension and OPEB Obligations and Plan Assets
The following tables summarize the change in benefit obligations and related plan assets (dollars in millions):
Year Ended December 31, 2012
Pension Benefits Other Benefits
U.S. Plans Non-U.S. Plans U.S. Plans Non-U.S. Plans
Change in benefit obligations
Beginning benefit obligation ......................................... $108,562 $ 25,765 $ 5,822 $ 1,490
Service cost ....................................................... 452 383 23 16
Interest cost ....................................................... 4,055 1,110 234 63
Plan participants’ contributions ....................................... — 7 4 1
Amendments ...................................................... (32) 139 — (52)
Actuarial losses .................................................... 8,432 2,774 622 13
Benefits paid ...................................................... (8,422) (1,551) (436) (55)
Foreign currency translation adjustments ................................ — 682 — 30
Curtailments, settlements and other .................................... (30,937) (8) 2 22
Ending benefit obligation ............................................ 82,110 29,301 6,271 1,528
Change in plan assets
Beginning fair value of plan assets ..................................... 94,349 14,541 — —
Actual return on plan assets .......................................... 10,332 1,344 — —
Employer contributions ............................................. 2,420 855 432 54
Plan participants’ contributions ....................................... — 7 4 1
Benefits paid ...................................................... (8,422) (1,551) (436) (55)
Foreign currency translation adjustments ................................ — 389 — —
Settlements ....................................................... (30,629) (207) — —
Other ............................................................ 35 163 — —
Ending fair value of plan assets ....................................... 68,085 15,541 — —
Ending funded status ............................................... $(14,025) $(13,760) $(6,271) $(1,528)
Amounts recorded in the consolidated balance sheets
Non-current assets ................................................. $ — $ 73 $ — $ —
Current liabilities .................................................. (95) (343) (406) (84)
Non-current liabilities ............................................... (13,930) (13,490) (5,865) (1,444)
Net amount recorded ............................................... $(14,025) $(13,760) $(6,271) $(1,528)
Amounts recorded in Accumulated other comprehensive loss
Net actuarial loss .................................................. $ (1,434) $ (4,786) $(1,573) $ (188)
Net prior service (cost) credit ......................................... 42 (111) 135 118
Total recorded in Accumulated other comprehensive loss .................. $ (1,392) $ (4,897) $(1,438) $ (70)
General Motors Company 2012 ANNUAL REPORT126