General Motors 2012 Annual Report Download - page 95
Download and view the complete annual report
Please find page 95 of the 2012 General Motors annual report below. You can navigate through the pages in the report by either clicking on the pages listed below, or by using the keyword search tool below to find specific information within the annual report.-
 1
1 -
2
-
3
-
4
-
5
-
6
-
7
-
8
-
9
-
10
-
11
-
12
-
13
-
14
-
15
-
16
-
17
-
18
-
19
-
20
-
21
-
22
-
23
-
24
-
25
-
26
-
27
-
28
-
29
-
30
-
31
-
32
-
33
-
34
-
35
-
36
-
37
-
38
-
39
-
40
-
41
-
42
-
43
-
44
-
45
-
46
-
47
-
48
-
49
-
50
-
51
-
52
-
53
-
54
-
55
-
56
-
57
-
58
-
59
-
60
-
61
-
62
-
63
-
64
-
65
-
66
-
67
-
68
-
69
-
70
-
71
-
72
-
73
-
74
-
75
-
76
-
77
-
78
-
79
-
80
-
81
-
82
-
83
-
84
-
 85
85 -
 86
86 -
 87
87 -
 88
88 -
 89
89 -
 90
90 -
 91
91 -
 92
92 -
 93
93 -
 94
94 -
 95
95 -
 96
96 -
 97
97 -
 98
98 -
 99
99 -
 100
100 -
 101
101 -
 102
102 -
 103
103 -
 104
104 -
 105
105 -
106
-
107
-
108
-
109
-
110
-
111
-
112
-
113
-
114
-
115
-
116
-
117
-
118
-
119
-
120
-
121
-
122
-
123
-
124
-
125
-
126
-
127
-
128
-
129
-
130
-
131
-
132
-
133
-
134
-
135
-
136
-
137
-
138
-
139
-
140
-
141
-
142
-
143
-
144
-
145
-
146
-
147
-
148
-
149
-
150
-
151
-
152
-
153
-
154
-
155
-
156
-
157
-
158
-
159
-
160
-
161
-
162
-
163
-
164
-
165
-
166
-
167
-
168
-
169
-
170
-
171
-
172
-
173
-
174
-
175
-
176
-
177
-
178
-
179
-
180
-
181
-
182
 |
 |

GENERAL MOTORS COMPANY AND SUBSIDIARIES
NOTES TO CONSOLIDATED FINANCIAL STATEMENTS — (Continued)
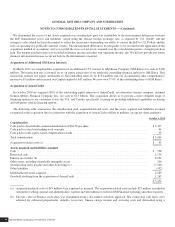
flows from that date forward. GMS was sold in January 2013 as previously discussed. The following table summarizes the amounts
recorded in connection with the acquisition of GMS, which are included in our GME segment (dollars in millions):
October 1, 2010
Assets acquired and liabilities assumed
Cash ........................................................................................... $ 49
Accounts receivable (a) ............................................................................ 60
Inventory ....................................................................................... 56
Property, net .................................................................................... 25
Other non-current assets ........................................................................... 3
Current liabilities ................................................................................. (116)
Non-current liabilities ............................................................................. (11)
Bargain purchase gain ............................................................................. $ 66
(a) Accounts receivable includes $32 million that is due from us.
We determined that the excess of fair value over consideration paid was attributable to potential future restructuring scenarios made
necessary due to the uncertainty in sales demand beyond in-place supply agreements. Restructuring costs, if incurred, would be
expensed in future periods. As potential future restructuring activities do not qualify to be recorded as a liability in the application of
the acquisition method of accounting, none was recorded, and we recorded the excess as a bargain purchase gain, recorded in Interest
income and other non-operating income, net. We did not provide the pro forma financial information because we do not believe the
information was material.
Saab Sale
In February 2010 we completed the sale of Saab Automobile AB and in May 2010 we completed the sale of Saab Automobile GB
(collectively Saab) to Spyker Cars NV. Of the negotiated cash purchase price of $74 million, we received $50 million at closing and
received the remainder in July 2010. We also received preference shares in Saab with a face value of $326 million and an estimated
fair value that is insignificant and received $114 million as repayment of the debtor-in-possession financing that we provided to Saab
during 2009. In the year ended December 31, 2010 we recorded a gain of $123 million in Interest income and other non-operating
income, net reflecting cash received of $166 million less net assets with a book value of $43 million.
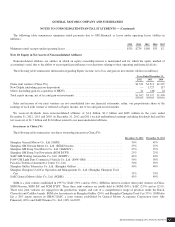
Note 5. GM Financial Finance Receivables, net
In April 2012 GM Financial commenced commercial lending activities in the U.S. centered on floorplan financing of dealer vehicle
inventory and dealer loans to finance dealer sites, facilities, facility improvements and working capital. These loans are made on a
secured basis.
The following table summarizes GM Financial finance receivables, net relating to consumer and commercial activities (dollars in
millions):
December 31, 2012 December 31, 2011
Current ........................................................................ $ 4,044 $3,251
Non-current .................................................................... 6,954 5,911
Total GM Financial finance receivables, net .......................................... $10,998 $9,162
General Motors Company 2012 ANNUAL REPORT92