General Motors 2012 Annual Report Download - page 35
Download and view the complete annual report
Please find page 35 of the 2012 General Motors annual report below. You can navigate through the pages in the report by either clicking on the pages listed below, or by using the keyword search tool below to find specific information within the annual report.-
 1
1 -
2
-
3
-
4
-
5
-
6
-
7
-
8
-
9
-
10
-
11
-
12
-
13
-
14
-
15
-
16
-
17
-
18
-
19
-
20
-
21
-
22
-
23
-
24
-
 25
25 -
 26
26 -
 27
27 -
 28
28 -
 29
29 -
 30
30 -
 31
31 -
 32
32 -
 33
33 -
 34
34 -
 35
35 -
 36
36 -
 37
37 -
 38
38 -
 39
39 -
 40
40 -
 41
41 -
 42
42 -
 43
43 -
 44
44 -
 45
45 -
46
-
47
-
48
-
49
-
50
-
51
-
52
-
53
-
54
-
55
-
56
-
57
-
58
-
59
-
60
-
61
-
62
-
63
-
64
-
65
-
66
-
67
-
68
-
69
-
70
-
71
-
72
-
73
-
74
-
75
-
76
-
77
-
78
-
79
-
80
-
81
-
82
-
83
-
84
-
85
-
86
-
87
-
88
-
89
-
90
-
91
-
92
-
93
-
94
-
95
-
96
-
97
-
98
-
99
-
100
-
101
-
102
-
103
-
104
-
105
-
106
-
107
-
108
-
109
-
110
-
111
-
112
-
113
-
114
-
115
-
116
-
117
-
118
-
119
-
120
-
121
-
122
-
123
-
124
-
125
-
126
-
127
-
128
-
129
-
130
-
131
-
132
-
133
-
134
-
135
-
136
-
137
-
138
-
139
-
140
-
141
-
142
-
143
-
144
-
145
-
146
-
147
-
148
-
149
-
150
-
151
-
152
-
153
-
154
-
155
-
156
-
157
-
158
-
159
-
160
-
161
-
162
-
163
-
164
-
165
-
166
-
167
-
168
-
169
-
170
-
171
-
172
-
173
-
174
-
175
-
176
-
177
-
178
-
179
-
180
-
181
-
182
 |
 |

GENERAL MOTORS COMPANY AND SUBSIDIARIES
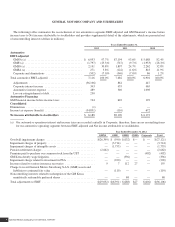
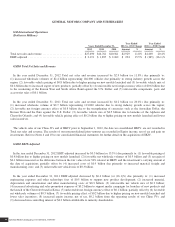
Interest Income and Other Non-Operating Income, net
Years Ended December 31,
Year Ended
2012 vs. 2011 Change
Year Ended
2011 vs. 2010 Change
2012 2011 2010 Amount % Amount %
Interest income and other non-operating income, net . . . $845 $851 $1,531 $(6) (0.7)% $(680) (44.4)%
In the year ended December 31, 2012 Interest income and other non-operating income, net decreased due primarily to: (1) a gain of
$0.3 billion related to the sale of our Ally Financial preferred stock in 2011 which did not recur in 2012; (2) an impairment charge of
$0.2 billion related to our investment in PSA; (3) a charge of $0.1 billion to record GMS assets and liabilities to estimated fair value;
(4) decreased interest income of $0.1 billion; (5) derivative losses of $0.1 billion related to fair value adjustments; partially offset by
(6) an impairment charge of $0.6 billion related to our investment in Ally Financial common stock in 2011 which did not recur in
2012; (7) income related to insurance recoveries of $0.2 billion.
In the year ended December 31, 2011 Interest income and other non-operating income, net decreased by $0.7 billion (or 44.4%) due
primarily to: (1) an impairment charge of $0.6 billion related to our investment in Ally Financial common stock; (2) a gain on the
reversal of an accrual for contingently issuable shares of our common stock to MLC (Adjustment Shares) of $0.2 billion in 2010
which did not recur in 2011; (3) gains on the sale of Saab Automobile AB and Saab Automobile GB (collectively Saab) and Nexteer
of $0.2 billion in 2010 which did not recur in 2011; and (4) a gain on the acquisition of GMS of $0.1 in 2010 which did not recur in
2011; partially offset by (5) a gain of $0.3 billion related to the sale of our Ally Financial preferred stock.
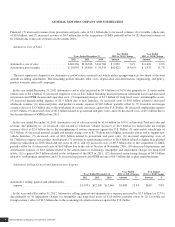
Gains (Losses) on Extinguishment of Debt
Years Ended December 31,
Year Ended
2012 vs. 2011 Change
Year Ended
2011 vs. 2010 Change
2012 2011 2010 Amount % Amount %
Gains (losses) on extinguishment of debt ............... $(250) $18 $196 $(268) n.m. $(178) (90.8)%
n.m. = not meaningful
In the year ended December 31, 2012, we recorded a loss on extinguishment of debt of $0.3 billion which primarily represented the
unamortized debt discount on the GM Korea mandatorily redeemable preferred shares.
In the year ended December 31, 2010 Gain on extinguishment of debt included a gain of $0.2 billion resulting from our repayment
of the outstanding amount of VEBA Notes of $2.8 billion.
Income Tax Expense (Benefit)
Years Ended December 31,
Year Ended
2012 vs. 2011 Change
Year Ended
2011 vs. 2010 Change
2012 2011 2010 Amount % Amount %
Income tax expense (benefit) ............................. $(34,831) $(110) $672 $(34,721) n.m. $(782) n.m.
n.m. = not meaningful
In the year ended December 31, 2012 income tax benefit increased by $34.7 billion due primarily to: (1) deferred tax asset
valuation allowance reversals of $36.3 billion in the U.S. and Canada in 2012 as compared to $0.5 billion in Australia in 2011; and
(2) change in U.S. federal tax elections which permitted us to record a tax benefit of $1.1 billion related to foreign tax credits; partially
offset by (3) current year U.S. income tax provision of $1.4 billion; and (4) income tax allocation from Accumulated other
comprehensive loss to Income tax expense (benefit) of $0.6 billion related to the U.S. salary pension plan.
General Motors Company 2012 ANNUAL REPORT32