General Motors 2012 Annual Report Download - page 63
Download and view the complete annual report
Please find page 63 of the 2012 General Motors annual report below. You can navigate through the pages in the report by either clicking on the pages listed below, or by using the keyword search tool below to find specific information within the annual report.-
 1
1 -
2
-
3
-
4
-
5
-
6
-
7
-
8
-
9
-
10
-
11
-
12
-
13
-
14
-
15
-
16
-
17
-
18
-
19
-
20
-
21
-
22
-
23
-
24
-
25
-
26
-
27
-
28
-
29
-
30
-
31
-
32
-
33
-
34
-
35
-
36
-
37
-
38
-
39
-
40
-
41
-
42
-
43
-
44
-
45
-
46
-
47
-
48
-
49
-
50
-
51
-
52
-
 53
53 -
 54
54 -
 55
55 -
 56
56 -
 57
57 -
 58
58 -
 59
59 -
 60
60 -
 61
61 -
 62
62 -
 63
63 -
 64
64 -
 65
65 -
 66
66 -
 67
67 -
 68
68 -
 69
69 -
 70
70 -
 71
71 -
 72
72 -
 73
73 -
74
-
75
-
76
-
77
-
78
-
79
-
80
-
81
-
82
-
83
-
84
-
85
-
86
-
87
-
88
-
89
-
90
-
91
-
92
-
93
-
94
-
95
-
96
-
97
-
98
-
99
-
100
-
101
-
102
-
103
-
104
-
105
-
106
-
107
-
108
-
109
-
110
-
111
-
112
-
113
-
114
-
115
-
116
-
117
-
118
-
119
-
120
-
121
-
122
-
123
-
124
-
125
-
126
-
127
-
128
-
129
-
130
-
131
-
132
-
133
-
134
-
135
-
136
-
137
-
138
-
139
-
140
-
141
-
142
-
143
-
144
-
145
-
146
-
147
-
148
-
149
-
150
-
151
-
152
-
153
-
154
-
155
-
156
-
157
-
158
-
159
-
160
-
161
-
162
-
163
-
164
-
165
-
166
-
167
-
168
-
169
-
170
-
171
-
172
-
173
-
174
-
175
-
176
-
177
-
178
-
179
-
180
-
181
-
182
 |
 |

GENERAL MOTORS COMPANY AND SUBSIDIARIES
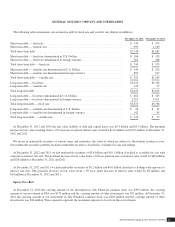
For purposes of our 2011 annual impairment testing procedures, the estimated fair values of our more significant reporting units
exceeded their carrying amounts by 12.3% for GMNA, 24.7% for Holden, 56.8% for GM Mercosur and 10.3% for GM Financial. In
calculating the fair values of our more significant reporting units during our 2011 annual goodwill impairment testing, keeping all
other assumptions constant, the estimated fair values of our more significant reporting units would still exceed their carrying amounts
had our WACC increased by 150 basis points for GMNA, 410 basis points for Holden and 430 basis points for GM Mercosur.
GM Financial’s forecasted equity-to-managed asset retention ratio by 2014 was 12.5% and held constant thereafter. GM Financial’s
fair value would still exceed its carrying amount had equity-to-managed assets retention ratio increased 230 basis points by 2014.
Based on the fair value measures determined during our 2012 and 2011 annual and event-driven impairment tests we determined
the fair values of those reporting units requiring a Step 2 analysis (GMNA, GME, GM Korea, GM South Africa and Holden) had not
increased sufficiently to give rise to an implied goodwill amount other than the goodwill arising from the fair value-to-U.S. GAAP
differences attributable to those assets and liabilities that gave rise to goodwill upon application of fresh-start reporting.
The key assumptions utilized in determining the fair value-to-U.S. GAAP differences giving rise to the implied goodwill for the
reporting units requiring a Step 2 analysis are: (1) the determination of our nonperformance risk; (2) interest rates; (3) estimates of our
employee benefit related obligations and; (4) the estimated timing of the utilization of our deferred tax assets, including our
determination whether it is more likely than not that the deferred tax assets will be utilized. Of these factors, the amount of implied
goodwill within GMNA was most sensitive to our determination whether it is more likely than not that the deferred tax assets will or
will not be utilized. Within GME the goodwill assessment was most sensitive to changes in our nonperformance risk, interest rates
and estimates of our employee benefit related obligations. The GM Korea goodwill assessment is and the Holden goodwill assessment
was most sensitive to our determination of whether it is more likely than not that their deferred tax assets will or will not be utilized.
The GM South Africa goodwill assessment was most sensitive to changes in our estimates of our employee benefit related obligations.
The $27.1 billion of impairment charges recorded in the year ended December 31, 2012 was primarily driven by the $36.2 billion
reversal of our deferred tax asset valuation allowances for our GMNA reporting unit. Refer to Note 21 to our consolidated financial
statements for additional information on the reversal of our valuation allowances for our U.S. and Canadian operations.
In the future we have an increased likelihood of measuring goodwill for possible impairment during our annual or event-driven
goodwill impairment testing because GM Korea’s fair value is less than its carrying amount, which increases the likelihood of
measuring goodwill for further impairment in the near-term. At December 31, 2012 GM Korea has $466 million of recorded goodwill.
Impairment of Long-Lived Assets
The carrying amount of long-lived assets and finite-lived intangible assets to be held and used in the business are evaluated for
impairment when events and circumstances warrant. If the carrying amount of a long-lived asset group is considered impaired, a loss
is recorded based on the amount by which the carrying amount exceeds the fair value for the long-lived assets or in certain cases, the
asset group to be held and used. Product-specific long-lived asset groups are tested for impairment at the platform or vehicle line
level. Non-product specific long-lived assets are tested for impairment on a reporting unit basis in GMNA, GME, and GM Financial
and tested at or within our various reporting units within our GMIO and GMSA segments. Assets classified as held for sale are
recorded at the lower of carrying amount or fair value less cost to sell. Fair value is determined using either the market or sales
comparison approach, cost approach or anticipated cash flows discounted at a rate commensurate with the risk involved. We develop
anticipated cash flows from historical experience and internal business plans. A considerable amount of management judgment and
assumptions are required in performing the long-lived asset impairment tests, principally in determining the fair value of the asset
groups and the assets’ average estimated useful life. While we believe our judgments and assumptions are reasonable, a change in
assumptions underlying these estimates could result in a material effect to the consolidated financial statements. Long-lived assets
could become impaired in the future as a result of declines in profitability due to significant changes in volume, pricing or costs.
The carrying amounts of substantially all of GME’s assets were established at fair value during fresh-start reporting. In the
determination of fair value, one of our key inputs was a forecasted cash flow projection. During 2010, our actual cash flows
approximated our projection. During the second half of 2011 and continuing into 2012, the European automotive industry has been
severely affected by the ongoing sovereign debt crisis, high unemployment and a lack of consumer confidence coupled with
General Motors Company 2012 ANNUAL REPORT60