General Motors 2012 Annual Report Download - page 177
Download and view the complete annual report
Please find page 177 of the 2012 General Motors annual report below. You can navigate through the pages in the report by either clicking on the pages listed below, or by using the keyword search tool below to find specific information within the annual report.-
 1
1 -
2
-
3
-
4
-
5
-
6
-
7
-
8
-
9
-
10
-
11
-
12
-
13
-
14
-
15
-
16
-
17
-
18
-
19
-
20
-
21
-
22
-
23
-
24
-
25
-
26
-
27
-
28
-
29
-
30
-
31
-
32
-
33
-
34
-
35
-
36
-
37
-
38
-
39
-
40
-
41
-
42
-
43
-
44
-
45
-
46
-
47
-
48
-
49
-
50
-
51
-
52
-
53
-
54
-
55
-
56
-
57
-
58
-
59
-
60
-
61
-
62
-
63
-
64
-
65
-
66
-
67
-
68
-
69
-
70
-
71
-
72
-
73
-
74
-
75
-
76
-
77
-
78
-
79
-
80
-
81
-
82
-
83
-
84
-
85
-
86
-
87
-
88
-
89
-
90
-
91
-
92
-
93
-
94
-
95
-
96
-
97
-
98
-
99
-
100
-
101
-
102
-
103
-
104
-
105
-
106
-
107
-
108
-
109
-
110
-
111
-
112
-
113
-
114
-
115
-
116
-
117
-
118
-
119
-
120
-
121
-
122
-
123
-
124
-
125
-
126
-
127
-
128
-
129
-
130
-
131
-
132
-
133
-
134
-
135
-
136
-
137
-
138
-
139
-
140
-
141
-
142
-
143
-
144
-
145
-
146
-
147
-
148
-
149
-
150
-
151
-
152
-
153
-
154
-
155
-
156
-
157
-
158
-
159
-
160
-
161
-
162
-
163
-
164
-
165
-
166
-
 167
167 -
 168
168 -
 169
169 -
 170
170 -
 171
171 -
 172
172 -
 173
173 -
 174
174 -
 175
175 -
 176
176 -
 177
177 -
 178
178 -
 179
179 -
 180
180 -
 181
181 -
 182
182
 |
 |

GENERAL MOTORS COMPANY AND SUBSIDIARIES
NOTES TO CONSOLIDATED FINANCIAL STATEMENTS — (Continued)
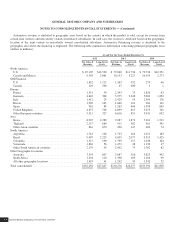
Automotive revenue is attributed to geographic areas based on the country in which the product is sold, except for revenue from
certain joint ventures and non-wholly owned consolidated subsidiaries. In such case, the revenue is attributed based on the geographic
location of the joint venture or non-wholly owned consolidated subsidiary. Automotive Financing revenue is attributed to the
geographic area where the financing is originated. The following table summarizes information concerning principal geographic areas
(dollars in millions):
At and For the Years Ended December 31,
2012 2011 2010
Net Sales &
Revenue
Long-Lived
Assets
Net Sales &
Revenue
Long-Lived
Assets
Net Sales &
Revenue
Long-Lived
Assets
North America
U.S. .......................................... $ 85,105 $13,520 $ 79,868 $11,736 $ 72,736 $10,351
Canada and Mexico .............................. 9,558 3,861 10,153 3,227 10,195 2,773
GM Financial
U.S. .......................................... 1,832 1,112 1,363 532 279 46
Canada ........................................ 129 590 47 300 2 1
Europe
France ........................................ 1,551 30 2,343 73 1,820 63
Germany ...................................... 4,610 308 5,975 2,348 5,004 1,852
Italy .......................................... 1,412 24 2,429 55 2,509 176
Russia ........................................ 1,990 165 1,668 124 964 132
Spain ......................................... 962 84 1,263 464 1,398 665
United Kingdom ................................ 4,875 518 4,899 815 5,253 761
Other European countries ......................... 5,311 327 6,616 851 5,941 632
Asia
Korea ......................................... 8,907 2,280 9,087 1,874 7,301 1,519
Thailand ...................................... 2,157 680 911 582 561 341
Other Asian countries ............................ 816 670 496 147 482 74
South America
Argentina ...................................... 1,741 146 1,723 164 1,215 183
Brazil ......................................... 9,407 2,229 9,635 2,077 9,513 1,425
Colombia ...................................... 1,527 190 1,799 117 1,438 104
Venezuela ..................................... 1,846 56 1,472 48 1,130 47
Other South American countries .................... 2,179 99 2,002 79 1,782 62
Other Geographic Locations
Australia ...................................... 3,554 607 3,887 516 3,623 492
South Africa ................................... 1,294 110 1,398 109 1,104 99
All other geographic locations ..................... 1,493 41 1,242 39 1,342 52
Total consolidated ................................. $152,256 $27,647 $150,276 $26,277 $135,592 $21,850
General Motors Company 2012 ANNUAL REPORT174