General Motors 2012 Annual Report Download - page 178
Download and view the complete annual report
Please find page 178 of the 2012 General Motors annual report below. You can navigate through the pages in the report by either clicking on the pages listed below, or by using the keyword search tool below to find specific information within the annual report.-
 1
1 -
2
-
3
-
4
-
5
-
6
-
7
-
8
-
9
-
10
-
11
-
12
-
13
-
14
-
15
-
16
-
17
-
18
-
19
-
20
-
21
-
22
-
23
-
24
-
25
-
26
-
27
-
28
-
29
-
30
-
31
-
32
-
33
-
34
-
35
-
36
-
37
-
38
-
39
-
40
-
41
-
42
-
43
-
44
-
45
-
46
-
47
-
48
-
49
-
50
-
51
-
52
-
53
-
54
-
55
-
56
-
57
-
58
-
59
-
60
-
61
-
62
-
63
-
64
-
65
-
66
-
67
-
68
-
69
-
70
-
71
-
72
-
73
-
74
-
75
-
76
-
77
-
78
-
79
-
80
-
81
-
82
-
83
-
84
-
85
-
86
-
87
-
88
-
89
-
90
-
91
-
92
-
93
-
94
-
95
-
96
-
97
-
98
-
99
-
100
-
101
-
102
-
103
-
104
-
105
-
106
-
107
-
108
-
109
-
110
-
111
-
112
-
113
-
114
-
115
-
116
-
117
-
118
-
119
-
120
-
121
-
122
-
123
-
124
-
125
-
126
-
127
-
128
-
129
-
130
-
131
-
132
-
133
-
134
-
135
-
136
-
137
-
138
-
139
-
140
-
141
-
142
-
143
-
144
-
145
-
146
-
147
-
148
-
149
-
150
-
151
-
152
-
153
-
154
-
155
-
156
-
157
-
158
-
159
-
160
-
161
-
162
-
163
-
164
-
165
-
166
-
167
-
 168
168 -
 169
169 -
 170
170 -
 171
171 -
 172
172 -
 173
173 -
 174
174 -
 175
175 -
 176
176 -
 177
177 -
 178
178 -
 179
179 -
 180
180 -
 181
181 -
 182
182
 |
 |

GENERAL MOTORS COMPANY AND SUBSIDIARIES
NOTES TO CONSOLIDATED FINANCIAL STATEMENTS — (Continued)
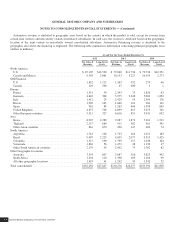
The following table summarizes the aggregation of principal geographic information by U.S. and non-U.S. (dollars in millions):
At and For the Years Ended December 31,
2012 2011 2010
Net Sales &
Revenue
Long-Lived
Assets
Net Sales &
Revenue
Long-Lived
Assets
Net Sales &
Revenue
Long-Lived
Assets
U.S. ............................................ $ 86,937 $14,632 $ 81,231 $12,268 $ 73,015 $10,397
Non-U.S. ........................................ 65,319 13,015 69,045 14,009 62,577 11,453
Total U.S. and non-U.S. ............................ $152,256 $27,647 $150,276 $26,277 $135,592 $21,850
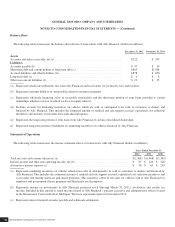
Note 30. Supplemental Information for the Consolidated Statements of Cash Flows
The following table summarizes the sources (uses) of cash provided by Change in other operating assets and liabilities and cash
paid for income taxes and interest (dollars in millions):
Years Ended December 31,
2012 2011 2010
Accounts receivable ................................................................... $ (460) $(1,572) $ (641)
Prepaid expenses and other deferred charges ................................................ (255) (165) 304
Inventories ........................................................................... (326) (2,760) (2,229)
Accounts payable ..................................................................... 162 2,139 2,257
Income taxes payable .................................................................. 155 (360) 54
Accrued liabilities and other liabilities ..................................................... 1,041 (727) (83)
Automotive equipment on operating leases ................................................. 370 (522) (628)
Total ............................................................................... $ 687 $(3,967) $ (966)
Cash paid for income taxes and interest
Cash paid for income taxes .............................................................. $ 575 $ 569 $ 357
Cash paid for interest — Automotive ...................................................... $ 452 $ 317 $1,001
Cash paid for interest — GM Financial .................................................... 298 284 66
Total cash paid for interest .............................................................. $ 750 $ 601 $1,067
Significant Non-Cash Activity
Investing Cash Flows
The following table summarizes the amounts of non-cash property additions that were excluded from Expenditures for property
within the investing activities section of the consolidated statement of cash flows because no cash was expended (dollars in millions):
Years Ended December 31,
2012 2011 2010
Non-cash property additions .............................................................. $3,879 $3,689 $2,290
General Motors Company 2012 ANNUAL REPORT 175