General Motors 2012 Annual Report Download - page 113
Download and view the complete annual report
Please find page 113 of the 2012 General Motors annual report below. You can navigate through the pages in the report by either clicking on the pages listed below, or by using the keyword search tool below to find specific information within the annual report.-
 1
1 -
2
-
3
-
4
-
5
-
6
-
7
-
8
-
9
-
10
-
11
-
12
-
13
-
14
-
15
-
16
-
17
-
18
-
19
-
20
-
21
-
22
-
23
-
24
-
25
-
26
-
27
-
28
-
29
-
30
-
31
-
32
-
33
-
34
-
35
-
36
-
37
-
38
-
39
-
40
-
41
-
42
-
43
-
44
-
45
-
46
-
47
-
48
-
49
-
50
-
51
-
52
-
53
-
54
-
55
-
56
-
57
-
58
-
59
-
60
-
61
-
62
-
63
-
64
-
65
-
66
-
67
-
68
-
69
-
70
-
71
-
72
-
73
-
74
-
75
-
76
-
77
-
78
-
79
-
80
-
81
-
82
-
83
-
84
-
85
-
86
-
87
-
88
-
89
-
90
-
91
-
92
-
93
-
94
-
95
-
96
-
97
-
98
-
99
-
100
-
101
-
102
-
 103
103 -
 104
104 -
 105
105 -
 106
106 -
 107
107 -
 108
108 -
 109
109 -
 110
110 -
 111
111 -
 112
112 -
 113
113 -
 114
114 -
 115
115 -
 116
116 -
 117
117 -
 118
118 -
 119
119 -
 120
120 -
 121
121 -
 122
122 -
 123
123 -
124
-
125
-
126
-
127
-
128
-
129
-
130
-
131
-
132
-
133
-
134
-
135
-
136
-
137
-
138
-
139
-
140
-
141
-
142
-
143
-
144
-
145
-
146
-
147
-
148
-
149
-
150
-
151
-
152
-
153
-
154
-
155
-
156
-
157
-
158
-
159
-
160
-
161
-
162
-
163
-
164
-
165
-
166
-
167
-
168
-
169
-
170
-
171
-
172
-
173
-
174
-
175
-
176
-
177
-
178
-
179
-
180
-
181
-
182
 |
 |

GENERAL MOTORS COMPANY AND SUBSIDIARIES
NOTES TO CONSOLIDATED FINANCIAL STATEMENTS — (Continued)
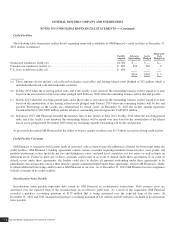
Our fair value estimates for annual and event-driven impairment tests assume the achievement of the future financial results
contemplated in our forecasted cash flows and there can be no assurance that we will realize that value. The estimates and
assumptions used are subject to significant uncertainties, many of which are beyond our control, and there is no assurance that
anticipated financial results will be achieved.
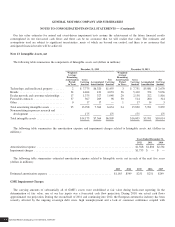
Note 13. Intangible Assets, net
The following table summarizes the components of Intangible assets, net (dollars in millions):
December 31, 2012 December 31, 2011
Weighted-
Average
Remaining
Amortization
Period
in Years
Gross
Carrying
Amount
Accumulated
Amortization
Net
Carrying
Amount
Weighted-
Average
Remaining
Amortization
Period
in Years
Gross
Carrying
Amount
Accumulated
Amortization
Net
Carrying
Amount
Technology and intellectual property ....... 2 $ 7,775 $6,320 $1,455 3 $ 7,751 $5,081 $ 2,670
Brands ............................... 34 4,464 431 4,033 36 5,410 374 5,036
Dealer network and customer relationships . . 17 1,375 327 1,048 20 2,138 322 1,816
Favorable contracts ..................... 37 367 269 98 30 514 200 314
Other ................................ 0 17 17 — 1 17 14 3
Total amortizing intangible assets .......... 25 13,998 7,364 6,634 24 15,830 5,991 9,839
Nonamortizing in process research and
development ........................ 175 175 175 175
Total intangible assets ................... $14,173 $7,364 $6,809 $16,005 $5,991 $10,014
The following table summarizes the amortization expense and impairment charges related to Intangible assets, net (dollars in
millions):
Years Ended December 31,
2012 2011 2010
Amortization expense ................................................................... $1,568 $1,804 $2,561
Impairment charges ..................................................................... $1,755 $ — $ —
The following table summarizes estimated amortization expense related to Intangible assets, net in each of the next five years
(dollars in millions):
2013 2014 2015 2016 2017
Estimated amortization expense ............................................ $1,165 $549 $251 $251 $249
GME Impairment Charges
The carrying amounts of substantially all of GME’s assets were established at fair value during fresh-start reporting. In the
determination of fair value, one of our key inputs was a forecasted cash flow projection. During 2010, our actual cash flows
approximated our projection. During the second half of 2011 and continuing into 2012, the European automotive industry has been
severely affected by the ongoing sovereign debt crisis, high unemployment and a lack of consumer confidence coupled with
General Motors Company 2012 ANNUAL REPORT110