General Motors 2012 Annual Report Download - page 70
Download and view the complete annual report
Please find page 70 of the 2012 General Motors annual report below. You can navigate through the pages in the report by either clicking on the pages listed below, or by using the keyword search tool below to find specific information within the annual report.-
 1
1 -
2
-
3
-
4
-
5
-
6
-
7
-
8
-
9
-
10
-
11
-
12
-
13
-
14
-
15
-
16
-
17
-
18
-
19
-
20
-
21
-
22
-
23
-
24
-
25
-
26
-
27
-
28
-
29
-
30
-
31
-
32
-
33
-
34
-
35
-
36
-
37
-
38
-
39
-
40
-
41
-
42
-
43
-
44
-
45
-
46
-
47
-
48
-
49
-
50
-
51
-
52
-
53
-
54
-
55
-
56
-
57
-
58
-
59
-
 60
60 -
 61
61 -
 62
62 -
 63
63 -
 64
64 -
 65
65 -
 66
66 -
 67
67 -
 68
68 -
 69
69 -
 70
70 -
 71
71 -
 72
72 -
 73
73 -
 74
74 -
 75
75 -
 76
76 -
 77
77 -
 78
78 -
 79
79 -
 80
80 -
81
-
82
-
83
-
84
-
85
-
86
-
87
-
88
-
89
-
90
-
91
-
92
-
93
-
94
-
95
-
96
-
97
-
98
-
99
-
100
-
101
-
102
-
103
-
104
-
105
-
106
-
107
-
108
-
109
-
110
-
111
-
112
-
113
-
114
-
115
-
116
-
117
-
118
-
119
-
120
-
121
-
122
-
123
-
124
-
125
-
126
-
127
-
128
-
129
-
130
-
131
-
132
-
133
-
134
-
135
-
136
-
137
-
138
-
139
-
140
-
141
-
142
-
143
-
144
-
145
-
146
-
147
-
148
-
149
-
150
-
151
-
152
-
153
-
154
-
155
-
156
-
157
-
158
-
159
-
160
-
161
-
162
-
163
-
164
-
165
-
166
-
167
-
168
-
169
-
170
-
171
-
172
-
173
-
174
-
175
-
176
-
177
-
178
-
179
-
180
-
181
-
182
 |
 |

GENERAL MOTORS COMPANY AND SUBSIDIARIES
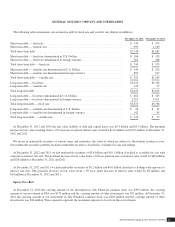
The following table summarizes GM Financial’s interest rate sensitive assets and liabilities, excluding derivatives, by year of
expected maturity and the fair value of those assets and liabilities at December 31, 2011 (dollars in millions):
Years Ended and Ending December 31, December 31, 2011
Fair Value2012 2013 2014 2015 2016 Thereafter
Assets
Finance receivables
Principal amounts .......................... $3,889 $2,571 $1,532 $ 946 $ 548 $ 265 $9,386
Weighted-average annual percentage rate ....... 15.19% 15.04% 14.87% 14.71% 14.52% 14.60%
Liabilities
Credit facilities
Principal amounts .......................... $1,099 $ — $ — $ — $ — $ — $1,099
Weighted-average interest rate ............... 1.88% —% —% —% —% —%
Securitization notes
Principal amounts .......................... $3,164 $1,481 $1,022 $ 720 $ 422 $ 86 $6,946
Weighted-average interest rate ............... 2.94% 3.51% 4.05% 4.58% 5.18% 3.64%
Senior notes
Principal amounts .......................... $ — $ — $ — $ — $ — $ 500 $ 510
Weighted-average interest rate ............... —% —% —% —% —% 6.75%
Convertible senior notes
Principal amounts .......................... $ — $ 1 $ — $ — $ — $ — $ 1
Weighted-average coupon interest rate ......... —% 2.13% —% —% —% —%
GM Financial estimates the realization of finance receivables in future periods using discount rate, prepayment and credit loss
assumptions similar to its historical experience. Credit facilities and securitization notes payable amounts have been classified based
on expected payoff. Senior notes and convertible senior notes principal amounts have been classified based on maturity.
*******
General Motors Company 2012 ANNUAL REPORT 67