General Motors 2012 Annual Report Download - page 131
Download and view the complete annual report
Please find page 131 of the 2012 General Motors annual report below. You can navigate through the pages in the report by either clicking on the pages listed below, or by using the keyword search tool below to find specific information within the annual report.-
 1
1 -
2
-
3
-
4
-
5
-
6
-
7
-
8
-
9
-
10
-
11
-
12
-
13
-
14
-
15
-
16
-
17
-
18
-
19
-
20
-
21
-
22
-
23
-
24
-
25
-
26
-
27
-
28
-
29
-
30
-
31
-
32
-
33
-
34
-
35
-
36
-
37
-
38
-
39
-
40
-
41
-
42
-
43
-
44
-
45
-
46
-
47
-
48
-
49
-
50
-
51
-
52
-
53
-
54
-
55
-
56
-
57
-
58
-
59
-
60
-
61
-
62
-
63
-
64
-
65
-
66
-
67
-
68
-
69
-
70
-
71
-
72
-
73
-
74
-
75
-
76
-
77
-
78
-
79
-
80
-
81
-
82
-
83
-
84
-
85
-
86
-
87
-
88
-
89
-
90
-
91
-
92
-
93
-
94
-
95
-
96
-
97
-
98
-
99
-
100
-
101
-
102
-
103
-
104
-
105
-
106
-
107
-
108
-
109
-
110
-
111
-
112
-
113
-
114
-
115
-
116
-
117
-
118
-
119
-
120
-
 121
121 -
 122
122 -
 123
123 -
 124
124 -
 125
125 -
 126
126 -
 127
127 -
 128
128 -
 129
129 -
 130
130 -
 131
131 -
 132
132 -
 133
133 -
 134
134 -
 135
135 -
 136
136 -
 137
137 -
 138
138 -
 139
139 -
 140
140 -
 141
141 -
142
-
143
-
144
-
145
-
146
-
147
-
148
-
149
-
150
-
151
-
152
-
153
-
154
-
155
-
156
-
157
-
158
-
159
-
160
-
161
-
162
-
163
-
164
-
165
-
166
-
167
-
168
-
169
-
170
-
171
-
172
-
173
-
174
-
175
-
176
-
177
-
178
-
179
-
180
-
181
-
182
 |
 |

GENERAL MOTORS COMPANY AND SUBSIDIARIES
NOTES TO CONSOLIDATED FINANCIAL STATEMENTS — (Continued)
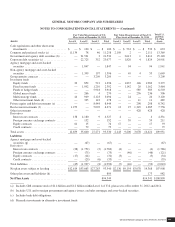
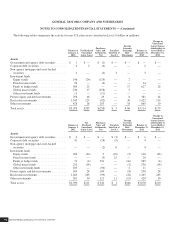
The following table summarizes the total accumulated benefit obligations (ABO), the fair value of plan assets for defined benefit
pension plans with ABO in excess of plan assets, and the projected benefit obligation (PBO) and fair value of plan assets for defined
benefit pension plans with PBO in excess of plan assets (dollars in millions):
December 31, 2012 December 31, 2011
U.S. Plans Non-U.S. Plans U.S. Plans Non-U.S. Plans
ABO ............................................................ $82,103 $28,880 $108,195 $25,404
Plans with ABO in excess of plan assets
ABO ............................................................ $82,103 $28,156 $108,195 $24,687
Fair value of plan assets ............................................. $68,085 $14,702 $ 94,349 $13,738
Plans with PBO in excess of plan assets
PBO ............................................................ $82,110 $28,537 $108,562 $25,024
Fair value of plan assets ............................................. $68,085 $14,704 $ 94,349 $13,739
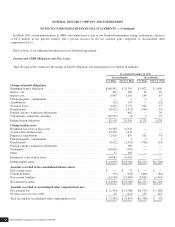
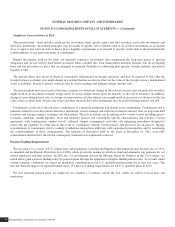
The following tables summarize the components of net periodic pension and OPEB expense along with the assumptions used to
determine benefit obligations (dollars in millions):
Year Ended December 31, 2012
Pension Benefits Other Benefits
U.S. Plans Non-U.S. Plans U.S. Plans Non-U.S. Plans
Components of expense
Service cost ....................................................... $ 590 $ 411 $ 23 $ 16
Interest cost ....................................................... 4,055 1,110 234 63
Expected return on plan assets ........................................ (5,029) (870) — —
Amortization of prior service cost (credit) ............................... (1) 1 (116) (12)
Recognized net actuarial loss ......................................... 2 35 52 6
Curtailments, settlements and other losses ............................... 2,580 71 — 11
Net periodic pension and OPEB expense ................................ $2,197 $ 758 $ 193 $ 84
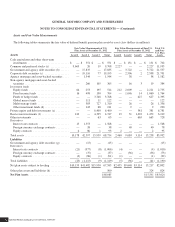
Weighted-average assumptions used to determine benefit obligations
Discount rate ...................................................... 3.59% 3.70% 3.68% 3.97%
Rate of compensation increase (a) ...................................... N/A 2.77% 4.50% 4.21%
Weighted-average assumptions used to determine net expense
Discount rate ...................................................... 4.06% 4.45% 4.24% 4.31%
Expected return on plan assets ........................................ 6.18% 6.20% N/A N/A
Rate of compensation increase ........................................ 4.50% 3.15% 4.50% 4.21%
(a) As a result of ceasing the accrual of additional benefits for participants in the Retiree Plan in 2012, the rate of compensation
increase does not have a significant effect on our U.S. pension plans.
General Motors Company 2012 ANNUAL REPORT128