General Motors 2012 Annual Report Download - page 96
Download and view the complete annual report
Please find page 96 of the 2012 General Motors annual report below. You can navigate through the pages in the report by either clicking on the pages listed below, or by using the keyword search tool below to find specific information within the annual report.-
 1
1 -
2
-
3
-
4
-
5
-
6
-
7
-
8
-
9
-
10
-
11
-
12
-
13
-
14
-
15
-
16
-
17
-
18
-
19
-
20
-
21
-
22
-
23
-
24
-
25
-
26
-
27
-
28
-
29
-
30
-
31
-
32
-
33
-
34
-
35
-
36
-
37
-
38
-
39
-
40
-
41
-
42
-
43
-
44
-
45
-
46
-
47
-
48
-
49
-
50
-
51
-
52
-
53
-
54
-
55
-
56
-
57
-
58
-
59
-
60
-
61
-
62
-
63
-
64
-
65
-
66
-
67
-
68
-
69
-
70
-
71
-
72
-
73
-
74
-
75
-
76
-
77
-
78
-
79
-
80
-
81
-
82
-
83
-
84
-
85
-
 86
86 -
 87
87 -
 88
88 -
 89
89 -
 90
90 -
 91
91 -
 92
92 -
 93
93 -
 94
94 -
 95
95 -
 96
96 -
 97
97 -
 98
98 -
 99
99 -
 100
100 -
 101
101 -
 102
102 -
 103
103 -
 104
104 -
 105
105 -
 106
106 -
107
-
108
-
109
-
110
-
111
-
112
-
113
-
114
-
115
-
116
-
117
-
118
-
119
-
120
-
121
-
122
-
123
-
124
-
125
-
126
-
127
-
128
-
129
-
130
-
131
-
132
-
133
-
134
-
135
-
136
-
137
-
138
-
139
-
140
-
141
-
142
-
143
-
144
-
145
-
146
-
147
-
148
-
149
-
150
-
151
-
152
-
153
-
154
-
155
-
156
-
157
-
158
-
159
-
160
-
161
-
162
-
163
-
164
-
165
-
166
-
167
-
168
-
169
-
170
-
171
-
172
-
173
-
174
-
175
-
176
-
177
-
178
-
179
-
180
-
181
-
182
 |
 |

GENERAL MOTORS COMPANY AND SUBSIDIARIES
NOTES TO CONSOLIDATED FINANCIAL STATEMENTS — (Continued)
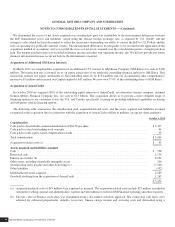
The following table summarizes the components of GM Financial finance receivables, net relating to consumer and commercial
activities (dollars in millions):
December 31, 2012 December 31, 2011
Pre-acquisition finance receivables, outstanding balance ................................. $ 2,162 $4,366
Pre-acquisition finance receivables, carrying amount ................................... $ 1,958 $4,027
Post-acquisition finance receivables, net of fees (a) ..................................... 9,391 5,314
Total finance receivables ......................................................... 11,349 9,341
Less: allowance for loan losses on post-acquisition finance receivables (a) .................. (351) (179)
Total GM Financial finance receivables, net .......................................... $10,998 $9,162
(a) At December 31, 2012 the balance includes finance receivables and loans of $560 million and allowance for loan losses of $6
million in connection with the commercial lending program.
The following table summarizes activity for finance receivables relating to consumer and commercial activities (dollars in
millions):
Years Ended December 31,
2012 2011
Pre-acquisition finance receivables, carrying amount, beginning of period ........................... $ 4,027 $ 7,299
Post-acquisition finance receivables, beginning of period ........................................ 5,314 924
Loans originated or purchased (a) ........................................................... 6,806 5,085
Charge-offs ............................................................................ (304) (66)
Principal collections and other (a) ........................................................... (4,324) (3,418)
Change in carrying amount adjustment on the pre-acquisition finance receivables ..................... (170) (483)
Balance at end of period .................................................................. $11,349 $ 9,341
(a) Includes finance receivables and loans originated of $1.2 billion and principal collections of $667 million in connection with the
commercial lending program for the year ended December 31, 2012.
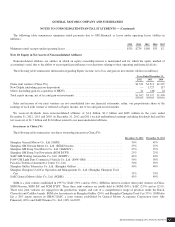
The following table summarizes carrying amount and estimated fair value of GM Financial finance receivables, net (dollars in
millions):
December 31, 2012 December 31, 2011
Carrying
Amount
Estimated
Fair Value
Carrying
Amount
Estimated
Fair Value
GM Financial finance receivables, net ......................................... $10,998 $11,313 $9,162 $9,386
GM Financial determined the fair value of consumer finance receivables using Level 3 inputs within a cash flow model. The Level
3 inputs reflect assumptions regarding expected prepayments, deferrals, delinquencies, recoveries and charge-offs of the loans within
the finance receivable portfolio. The cash flow model produces an estimated amortization schedule of the finance receivables which is
the basis for the calculation of the series of cash flows that derive the fair value of the portfolio. The series of cash flows are
calculated and discounted using a weighted-average cost of capital (WACC) using unobservable debt and equity percentages, an
unobservable cost of equity and an observable cost of debt based on companies with a similar credit rating and maturity and maturity
profile as the portfolio. Macroeconomic factors could negatively affect the credit performance of the portfolio and therefore could
potentially affect the assumptions used in GM Financial’s cash flow model.
General Motors Company 2012 ANNUAL REPORT 93