General Motors 2012 Annual Report Download - page 48
Download and view the complete annual report
Please find page 48 of the 2012 General Motors annual report below. You can navigate through the pages in the report by either clicking on the pages listed below, or by using the keyword search tool below to find specific information within the annual report.-
 1
1 -
2
-
3
-
4
-
5
-
6
-
7
-
8
-
9
-
10
-
11
-
12
-
13
-
14
-
15
-
16
-
17
-
18
-
19
-
20
-
21
-
22
-
23
-
24
-
25
-
26
-
27
-
28
-
29
-
30
-
31
-
32
-
33
-
34
-
35
-
36
-
37
-
 38
38 -
 39
39 -
 40
40 -
 41
41 -
 42
42 -
 43
43 -
 44
44 -
 45
45 -
 46
46 -
 47
47 -
 48
48 -
 49
49 -
 50
50 -
 51
51 -
 52
52 -
 53
53 -
 54
54 -
 55
55 -
 56
56 -
 57
57 -
 58
58 -
59
-
60
-
61
-
62
-
63
-
64
-
65
-
66
-
67
-
68
-
69
-
70
-
71
-
72
-
73
-
74
-
75
-
76
-
77
-
78
-
79
-
80
-
81
-
82
-
83
-
84
-
85
-
86
-
87
-
88
-
89
-
90
-
91
-
92
-
93
-
94
-
95
-
96
-
97
-
98
-
99
-
100
-
101
-
102
-
103
-
104
-
105
-
106
-
107
-
108
-
109
-
110
-
111
-
112
-
113
-
114
-
115
-
116
-
117
-
118
-
119
-
120
-
121
-
122
-
123
-
124
-
125
-
126
-
127
-
128
-
129
-
130
-
131
-
132
-
133
-
134
-
135
-
136
-
137
-
138
-
139
-
140
-
141
-
142
-
143
-
144
-
145
-
146
-
147
-
148
-
149
-
150
-
151
-
152
-
153
-
154
-
155
-
156
-
157
-
158
-
159
-
160
-
161
-
162
-
163
-
164
-
165
-
166
-
167
-
168
-
169
-
170
-
171
-
172
-
173
-
174
-
175
-
176
-
177
-
178
-
179
-
180
-
181
-
182
 |
 |

GENERAL MOTORS COMPANY AND SUBSIDIARIES
Automotive
Available Liquidity
Total available liquidity includes cash, cash equivalents, marketable securities and funds available under credit facilities. At
December 31, 2012 our total available liquidity was $37.2 billion, including funds available under credit facilities of $11.1 billion.
The amount of available liquidity is subject to intra-month and seasonal fluctuations and includes balances held by various business
units and subsidiaries worldwide that are needed to fund their operations.
We manage our liquidity primarily at our treasury centers as well as at certain of our significant consolidated overseas subsidiaries.
Available liquidity held within North America and at our regional treasury centers represented approximately 84% of our available
liquidity at December 31, 2012. A portion of our available liquidity includes amounts deemed indefinitely reinvested in our foreign
subsidiaries. We have used and will continue to use other methods including intercompany loans to utilize these funds across our
global operations as needed.
Our cash equivalents and marketable securities balances include investments in U.S. government and agency obligations, foreign
government securities, time deposits and certificates of deposits and corporate debt securities, and are primarily denominated in U.S.
Dollars and CAD. We maintained cash investments in CAD denominated securities of $6.6 billion at December 31, 2012. These cash
investments will incur foreign exchange gains or losses based on the movement of the CAD in relation to the U.S. Dollar and will
therefore reduce our net CAD foreign exchange exposure, which primarily relates to pension and OPEB liabilities. We expect to
maintain a sufficient amount of CAD deposits and investments to offset the liabilities denominated in CAD and expect the amount of
CAD denominated securities to decrease in 2013. These funds continue to be available to fund our normal ongoing operations and are
included in our available liquidity.
Our investment guidelines, which we may change from time to time, prescribe certain minimum credit rating thresholds and limit
our exposures to any particular sector, asset class, issuance or security type. Substantially all of our current investments in debt
securities are with A/A2 or better rated issuers. We actively monitor and manage our liquidity exposure to Europe which is related
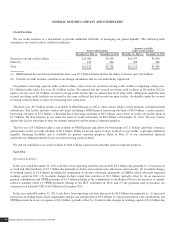
primarily to short-term bank deposits and short-term debt securities of high-quality European issuers. The following table summarizes
our liquidity (dollars in millions):
December 31, 2012 December 31, 2011
Cash and cash equivalents ......................................................... $17,133 $15,499
Marketable securities ............................................................ 8,988 16,148
Available liquidity ............................................................. 26,121 31,647
Available under credit facilities .................................................... 11,119 5,308
Total available liquidity ........................................................ $37,240 $36,955
Total available liquidity increased by $0.3 billion in the year ended December 31, 2012 due primarily to: (1) cash provided by
operating activities of $9.6 billion; and (2) an increase in amounts available under credit facilities of $5.8 billion related to our new
secured revolving credit facilities; partially offset by (3) capital expenditures of $8.1 billion; and (4) cash used in financing activities
of $7.1 billion relating to the purchase of our common stock, debt prepayments and dividend payments.
General Motors Company 2012 ANNUAL REPORT 45