General Motors 2012 Annual Report Download - page 76
Download and view the complete annual report
Please find page 76 of the 2012 General Motors annual report below. You can navigate through the pages in the report by either clicking on the pages listed below, or by using the keyword search tool below to find specific information within the annual report.-
 1
1 -
2
-
3
-
4
-
5
-
6
-
7
-
8
-
9
-
10
-
11
-
12
-
13
-
14
-
15
-
16
-
17
-
18
-
19
-
20
-
21
-
22
-
23
-
24
-
25
-
26
-
27
-
28
-
29
-
30
-
31
-
32
-
33
-
34
-
35
-
36
-
37
-
38
-
39
-
40
-
41
-
42
-
43
-
44
-
45
-
46
-
47
-
48
-
49
-
50
-
51
-
52
-
53
-
54
-
55
-
56
-
57
-
58
-
59
-
60
-
61
-
62
-
63
-
64
-
65
-
 66
66 -
 67
67 -
 68
68 -
 69
69 -
 70
70 -
 71
71 -
 72
72 -
 73
73 -
 74
74 -
 75
75 -
 76
76 -
 77
77 -
 78
78 -
 79
79 -
 80
80 -
 81
81 -
 82
82 -
 83
83 -
 84
84 -
 85
85 -
 86
86 -
87
-
88
-
89
-
90
-
91
-
92
-
93
-
94
-
95
-
96
-
97
-
98
-
99
-
100
-
101
-
102
-
103
-
104
-
105
-
106
-
107
-
108
-
109
-
110
-
111
-
112
-
113
-
114
-
115
-
116
-
117
-
118
-
119
-
120
-
121
-
122
-
123
-
124
-
125
-
126
-
127
-
128
-
129
-
130
-
131
-
132
-
133
-
134
-
135
-
136
-
137
-
138
-
139
-
140
-
141
-
142
-
143
-
144
-
145
-
146
-
147
-
148
-
149
-
150
-
151
-
152
-
153
-
154
-
155
-
156
-
157
-
158
-
159
-
160
-
161
-
162
-
163
-
164
-
165
-
166
-
167
-
168
-
169
-
170
-
171
-
172
-
173
-
174
-
175
-
176
-
177
-
178
-
179
-
180
-
181
-
182
 |
 |

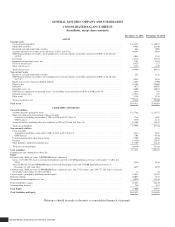
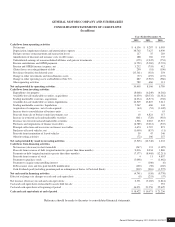
GENERAL MOTORS COMPANY AND SUBSIDIARIES
CONSOLIDATED STATEMENTS OF CASH FLOWS
(In millions)
Years Ended December 31,
2012 2011 2010
Cash flows from operating activities
Net income ................................................................................ $ 6,136 $ 9,287 $ 6,503
Depreciation, impairment charges and amortization expense ......................................... 38,762 7,427 6,930
Foreign currency remeasurement and transaction losses ............................................. 117 55 210
Amortization of discount and issuance costs on debt issues .......................................... 188 160 135
Undistributed earnings of nonconsolidated affiliates and gain on investments ............................ (179) (1,947) (753)
Pension contributions and OPEB payments ....................................................... (3,759) (2,269) (5,723)
Pension and OPEB (income) expense, net ........................................................ 3,232 (755) 412
(Gains) losses on extinguishment of debt ......................................................... 250 (18) (196)
Provisions (benefits) for deferred taxes .......................................................... (35,561) (318) 254
Change in other investments and miscellaneous assets .............................................. (57) (155) (137)
Change in other operating assets and liabilities (Note 30) ............................................ 687 (3,967) (966)
Other operating activities ..................................................................... 789 666 111
Net cash provided by operating activities ......................................................... 10,605 8,166 6,780
Cash flows from investing activities
Expenditures for property ..................................................................... (8,068) (6,249) (4,202)
Available-for-sale marketable securities, acquisitions ............................................... (4,650) (20,535) (11,012)
Trading marketable securities, acquisitions ....................................................... (6,234) (6,571) (358)
Available-for-sale marketable securities, liquidations ............................................... 10,519 15,825 5,611
Trading marketable securities, liquidations ....................................................... 7,267 660 343
Acquisition of companies, net of cash acquired .................................................... (44) (53) (3,042)
Increase due to consolidation of business units .................................................... — — 63
Proceeds from sale of business units/investments, net ............................................... 18 4,821 317
Increase in restricted cash and marketable securities ................................................ (661) (728) (918)
Decrease in restricted cash and marketable securities ............................................... 1,526 2,067 13,915
Purchases and originations of finance receivables .................................................. (6,789) (5,012) (947)
Principal collections and recoveries on finance receivables .......................................... 4,674 3,719 871
Purchases of leased vehicles, net ............................................................... (1,050) (837) (11)
Proceeds from termination of leased vehicles ..................................................... 59 47 346
Other investing activities ..................................................................... (72) 106 257
Net cash provided by (used in) investing activities ................................................. (3,505) (12,740) 1,233
Cash flows from financing activities
Net increase (decrease) in short-term debt ........................................................ (247) 131 (1,097)
Proceeds from issuance of debt (original maturities greater than three months) ........................... 9,036 9,034 1,886
Payments on debt (original maturities greater than three months) ...................................... (7,377) (8,468) (12,211)
Proceeds from issuance of stock ................................................................ 4 11 4,857
Payments to purchase stock ................................................................... (5,098) — (1,462)
Payments to acquire noncontrolling interest ...................................................... — (100) (6)
Debt issuance costs and fees paid for debt modification ............................................. (120) (50) (165)
Cash dividends paid (including premium paid on redemption of Series A Preferred Stock) ................. (939) (916) (1,572)
Net cash used in financing activities ............................................................. (4,741) (358) (9,770)
Effect of exchange rate changes on cash and cash equivalents .......................................... (8) (253) (57)
Net increase (decrease) in cash and cash equivalents .................................................. 2,351 (5,185) (1,814)
Cash and cash equivalents reclassified to assets held for sale ........................................... — — 391
Cash and cash equivalents at beginning of period .................................................... 16,071 21,256 22,679
Cash and cash equivalents at end of period ....................................................... $18,422 $ 16,071 $ 21,256
Reference should be made to the notes to consolidated financial statements.
General Motors Company 2012 ANNUAL REPORT 73