General Motors 2012 Annual Report Download - page 40
Download and view the complete annual report
Please find page 40 of the 2012 General Motors annual report below. You can navigate through the pages in the report by either clicking on the pages listed below, or by using the keyword search tool below to find specific information within the annual report.-
 1
1 -
2
-
3
-
4
-
5
-
6
-
7
-
8
-
9
-
10
-
11
-
12
-
13
-
14
-
15
-
16
-
17
-
18
-
19
-
20
-
21
-
22
-
23
-
24
-
25
-
26
-
27
-
28
-
29
-
 30
30 -
 31
31 -
 32
32 -
 33
33 -
 34
34 -
 35
35 -
 36
36 -
 37
37 -
 38
38 -
 39
39 -
 40
40 -
 41
41 -
 42
42 -
 43
43 -
 44
44 -
 45
45 -
 46
46 -
 47
47 -
 48
48 -
 49
49 -
 50
50 -
51
-
52
-
53
-
54
-
55
-
56
-
57
-
58
-
59
-
60
-
61
-
62
-
63
-
64
-
65
-
66
-
67
-
68
-
69
-
70
-
71
-
72
-
73
-
74
-
75
-
76
-
77
-
78
-
79
-
80
-
81
-
82
-
83
-
84
-
85
-
86
-
87
-
88
-
89
-
90
-
91
-
92
-
93
-
94
-
95
-
96
-
97
-
98
-
99
-
100
-
101
-
102
-
103
-
104
-
105
-
106
-
107
-
108
-
109
-
110
-
111
-
112
-
113
-
114
-
115
-
116
-
117
-
118
-
119
-
120
-
121
-
122
-
123
-
124
-
125
-
126
-
127
-
128
-
129
-
130
-
131
-
132
-
133
-
134
-
135
-
136
-
137
-
138
-
139
-
140
-
141
-
142
-
143
-
144
-
145
-
146
-
147
-
148
-
149
-
150
-
151
-
152
-
153
-
154
-
155
-
156
-
157
-
158
-
159
-
160
-
161
-
162
-
163
-
164
-
165
-
166
-
167
-
168
-
169
-
170
-
171
-
172
-
173
-
174
-
175
-
176
-
177
-
178
-
179
-
180
-
181
-
182
 |
 |

GENERAL MOTORS COMPANY AND SUBSIDIARIES
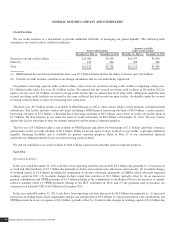
GM Europe
(Dollars in Millions)
Years Ended December 31,
Year Ended
2012 vs. 2011 Change
Year Ended
2011 vs. 2010 Change
2012 2011 2010 Amount % Amount %
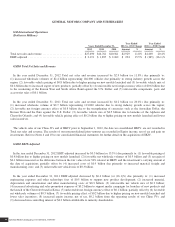
Total net sales and revenue ....................... $22,050 $26,757 $24,076 $(4,707) (17.6)% $2,681 11.1%
EBIT (loss)-adjusted ............................ $(1,797) $ (747) $ (1,953) $(1,050) n.m. $1,206 (61.8)%
GME Total Net Sales and Revenue
In the year ended December 31, 2012 Total net sales and revenue decreased by $4.7 billion (or 17.6%) due primarily to:
(1) decreased wholesale volumes of $2.7 billion representing 182,000 vehicles (or 14.4%) due to the weak European economy;
(2) unfavorable foreign currency effect of $1.7 billion, due to the strengthening of the U.S. Dollar against the Euro, Russian Ruble,
Hungarian Forint, Turkish Lira, and British Pound; (3) decreased parts, accessories and powertrain engine and transmission sales of
$0.4 billion associated with lower demand; (4) a decrease of $0.2 billion due to unfavorable price effects primarily resulting from
increased incentive support associated with strong competition; (5) a decrease of $0.1 billion due to the deconsolidation of VMM in
June 2011; (6) a decrease of $0.1 billion in components sales; partially offset by (7) favorable vehicle mix of $0.5 billion due to the
new generation Astra GTC, Opel Mokka, and Ampera and increased sales of other higher priced vehicles.
In the year ended December 31, 2011 Total net sales and revenue increased by $2.7 billion (or 11.1%) due primarily to:
(1) favorable foreign currency effect of $1.1 billion, due to the strengthening of the Euro, British Pound and Swiss Franc against the
U.S. Dollar; (2) favorable vehicle mix of $1.1 billion due to the new generation Opel Meriva and Opel Astra and increased sales of
other higher priced vehicles; (3) revenue from GMS of $0.4 billion, which we acquired in 2010; (4) increased powertrain engine and
transmission sales of $0.3 billion, in support of the Chevrolet Cruze and Chevrolet Volt; (5) increased components sales of
$0.2 billion; and (6) increased volumes of $0.1 billion due primarily to a 16,000 vehicles (or 1.3%) increase in wholesales; partially
offset by (7) a reduction in Saab brand sales of $0.2 billion related to the sale of Saab in 2010; and (8) a decrease of $0.1 billion due to
the deconsolidation of VMM in June 2011.
GME EBIT (Loss)-Adjusted
In the year ended December 31, 2012 EBIT (loss)-adjusted increased by $1.1 billion due primarily to: (1) decreased volumes of
$0.5 billion; (2) unfavorable net vehicle mix of $0.4 billion; (3) a decrease of $0.2 billion resulting from the net effect of changes in
an embedded foreign currency derivative asset associated with a long-term supply agreement; (4) decreased parts, accessories and
powertrain engine and transmission sales of $0.2 billion, associated with lower demand; (5) a decrease of $0.2 billion due to
unfavorable price effects; partially offset by (6) lower manufacturing and material costs of $0.4 billion and (7) favorable net foreign
currency effect of $0.1 billion, due to the strengthening of the U.S. Dollar against the Euro, Russian Ruble, Hungarian Forint, Turkish
Lira, and British Pound.
In the year ended December 31, 2011 EBIT (loss)-adjusted decreased by $1.2 billion (or 61.8%) due primarily to: (1) higher
restructuring charges of $0.5 billion recorded in 2010 for separation programs in Belgium, Spain, Germany and the United Kingdom;
(2) decreased manufacturing costs of $0.3 billion related to the closing of the Antwerp, Belgium facility and European wide labor
savings; (3) favorable net vehicle mix of $0.2 billion; (4) an increase of $0.2 billion in an embedded foreign currency exchange
derivative asset associated with a long-term supply agreement entered into in 2010; (5) EBIT-adjusted from GMS of $0.1 billion;
offset by (6) unfavorable net foreign currency effect of $0.1 billion; and (7) charges of $0.1 billion related to a single customer’s
default under various commercial supply agreements.
General Motors Company 2012 ANNUAL REPORT 37