General Motors 2012 Annual Report Download - page 41
Download and view the complete annual report
Please find page 41 of the 2012 General Motors annual report below. You can navigate through the pages in the report by either clicking on the pages listed below, or by using the keyword search tool below to find specific information within the annual report.-
 1
1 -
2
-
3
-
4
-
5
-
6
-
7
-
8
-
9
-
10
-
11
-
12
-
13
-
14
-
15
-
16
-
17
-
18
-
19
-
20
-
21
-
22
-
23
-
24
-
25
-
26
-
27
-
28
-
29
-
30
-
 31
31 -
 32
32 -
 33
33 -
 34
34 -
 35
35 -
 36
36 -
 37
37 -
 38
38 -
 39
39 -
 40
40 -
 41
41 -
 42
42 -
 43
43 -
 44
44 -
 45
45 -
 46
46 -
 47
47 -
 48
48 -
 49
49 -
 50
50 -
 51
51 -
52
-
53
-
54
-
55
-
56
-
57
-
58
-
59
-
60
-
61
-
62
-
63
-
64
-
65
-
66
-
67
-
68
-
69
-
70
-
71
-
72
-
73
-
74
-
75
-
76
-
77
-
78
-
79
-
80
-
81
-
82
-
83
-
84
-
85
-
86
-
87
-
88
-
89
-
90
-
91
-
92
-
93
-
94
-
95
-
96
-
97
-
98
-
99
-
100
-
101
-
102
-
103
-
104
-
105
-
106
-
107
-
108
-
109
-
110
-
111
-
112
-
113
-
114
-
115
-
116
-
117
-
118
-
119
-
120
-
121
-
122
-
123
-
124
-
125
-
126
-
127
-
128
-
129
-
130
-
131
-
132
-
133
-
134
-
135
-
136
-
137
-
138
-
139
-
140
-
141
-
142
-
143
-
144
-
145
-
146
-
147
-
148
-
149
-
150
-
151
-
152
-
153
-
154
-
155
-
156
-
157
-
158
-
159
-
160
-
161
-
162
-
163
-
164
-
165
-
166
-
167
-
168
-
169
-
170
-
171
-
172
-
173
-
174
-
175
-
176
-
177
-
178
-
179
-
180
-
181
-
182
 |
 |

GENERAL MOTORS COMPANY AND SUBSIDIARIES
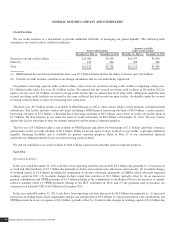
GM International Operations
(Dollars in Millions)
Years Ended December 31,
Year Ended
2012 vs. 2011 Change
Year Ended
2011 vs. 2010 Change
2012 2011 2010 Amount % Amount %
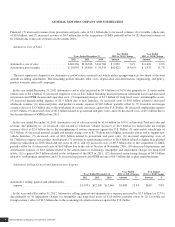
Total net sales and revenue ............................ $27,690 $24,761 $20,561 $2,929 11.8% $4,200 20.4%
EBIT-adjusted ...................................... $ 2,191 $ 1,897 $ 2,262 $ 294 15.5% $ (365) (16.1)%
GMIO Total Net Sales and Revenue
In the year ended December 31, 2012 Total net sales and revenue increased by $2.9 billion (or 11.8%) due primarily to:
(1) increased wholesale volumes of $2.4 billion representing 146,000 vehicles due primarily to strong industry growth across the
region; (2) favorable vehicle pricing of $0.8 billion due to higher pricing on new models launched and (3) favorable vehicle mix of
$0.4 billion due to increased export of new products; partially offset by (4) unfavorable net foreign currency effect of $0.6 billion due
to the weakening of the Korean Won and South Africa Rand against the U.S. Dollar; and (5) unfavorable components, parts and
accessories sales of $0.1 billion.
In the year ended December 31, 2011 Total net sales and revenue increased by $4.2 billion (or 20.4%) due primarily to:
(1) increased wholesale volume of $2.7 billion representing 113,000 vehicles due to strong industry growth across the region;
(2) favorable net foreign currency effect of $0.8 billion due to the strengthening of currencies such as the Australian Dollar, the
Korean Won and the Euro against the U.S. Dollar; (3) favorable vehicle mix of $0.5 billion due to launches of the Alpheon and
Chevrolet Orlando; and (4) favorable vehicle pricing effect of $0.2 billion due to higher pricing on new models launched and lower
sales incentives.
The vehicle sales of our China JVs and of HKJV prior to September 1, 2012, the date we consolidated HKJV, are not recorded in
Total net sales and revenue. The results of our nonconsolidated joint ventures are recorded in Equity income, net of tax and gain on
investments. Refer to Notes 4 and 10 to our consolidated financial statements for further detail on the acquisition of HKJV.
GMIO EBIT-Adjusted
In the year ended December 31, 2012 EBIT-adjusted increased by $0.3 billion (or 15.5%) due primarily to: (1) favorable pricing of
$0.8 billion due to higher pricing on new models launched; (2) favorable net wholesale volumes of $0.5 billion and (3) net gain of
$0.1 billion measured as the difference between the fair value of our 50% interest in HKJV and the investment’s carrying amount at
the date of acquisition; partially offset by (4) increased costs of $0.9 billion due primarily to increased material, freight and
manufacturing costs; and (5) unfavorable net vehicle mix of $0.3 billion.
In the year ended December 31, 2011 EBIT-adjusted decreased by $0.4 billion (or (16.1)%) due primarily to: (1) increased
engineering expenses and other technology fees of $0.5 billion to support new product development; (2) increased material,
depreciation and amortization and other manufacturing costs of $0.3 billion; (3) unfavorable net vehicle mix of $0.2 billion;
(4) increased advertising and sales promotion expenses of $0.2 billion to support media campaigns for launches of new products and
the launch of the Chevrolet brand in Korea; (5) unfavorable net foreign currency effect of $0.1 billion; partially offset by (6) favorable
net wholesale volumes of $0.5 billion; (7) favorable pricing effect of $0.2 billion due to higher pricing on new models launched and
lower sales incentives; (8) increased equity income, net of tax, $0.2 billion from the operating results of our China JVs; and
(9) decreased non-controlling interest of $0.2 billion attributable to minority shareholders.
General Motors Company 2012 ANNUAL REPORT38