General Motors 2012 Annual Report Download - page 75
Download and view the complete annual report
Please find page 75 of the 2012 General Motors annual report below. You can navigate through the pages in the report by either clicking on the pages listed below, or by using the keyword search tool below to find specific information within the annual report.-
 1
1 -
2
-
3
-
4
-
5
-
6
-
7
-
8
-
9
-
10
-
11
-
12
-
13
-
14
-
15
-
16
-
17
-
18
-
19
-
20
-
21
-
22
-
23
-
24
-
25
-
26
-
27
-
28
-
29
-
30
-
31
-
32
-
33
-
34
-
35
-
36
-
37
-
38
-
39
-
40
-
41
-
42
-
43
-
44
-
45
-
46
-
47
-
48
-
49
-
50
-
51
-
52
-
53
-
54
-
55
-
56
-
57
-
58
-
59
-
60
-
61
-
62
-
63
-
64
-
 65
65 -
 66
66 -
 67
67 -
 68
68 -
 69
69 -
 70
70 -
 71
71 -
 72
72 -
 73
73 -
 74
74 -
 75
75 -
 76
76 -
 77
77 -
 78
78 -
 79
79 -
 80
80 -
 81
81 -
 82
82 -
 83
83 -
 84
84 -
 85
85 -
86
-
87
-
88
-
89
-
90
-
91
-
92
-
93
-
94
-
95
-
96
-
97
-
98
-
99
-
100
-
101
-
102
-
103
-
104
-
105
-
106
-
107
-
108
-
109
-
110
-
111
-
112
-
113
-
114
-
115
-
116
-
117
-
118
-
119
-
120
-
121
-
122
-
123
-
124
-
125
-
126
-
127
-
128
-
129
-
130
-
131
-
132
-
133
-
134
-
135
-
136
-
137
-
138
-
139
-
140
-
141
-
142
-
143
-
144
-
145
-
146
-
147
-
148
-
149
-
150
-
151
-
152
-
153
-
154
-
155
-
156
-
157
-
158
-
159
-
160
-
161
-
162
-
163
-
164
-
165
-
166
-
167
-
168
-
169
-
170
-
171
-
172
-
173
-
174
-
175
-
176
-
177
-
178
-
179
-
180
-
181
-
182
 |
 |

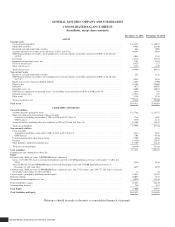
GENERAL MOTORS COMPANY AND SUBSIDIARIES
CONSOLIDATED BALANCE SHEETS
(In millions, except share amounts)
December 31, 2012 December 31, 2011
ASSETS
Current Assets
Cash and cash equivalents ................................................................................. $ 18,422 $ 16,071
Marketable securities .................................................................................... 8,988 16,148
Restricted cash and marketable securities ..................................................................... 686 1,005
Accounts and notes receivable (net of allowance of $311 and $331) ................................................ 10,395 9,964
GM Financial finance receivables, net (including gross consumer finance receivables transferred to SPEs of $3,444 and
$3,295) .............................................................................................. 4,044 3,251
Inventories ............................................................................................. 14,714 14,324
Equipment on operating leases, net .......................................................................... 1,782 2,464
Deferred income taxes .................................................................................... 9,429 527
Other current assets ...................................................................................... 1,536 1,169
Total current assets ...................................................................................... 69,996 64,923
Non-current Assets
Restricted cash and marketable securities ..................................................................... 682 1,228
GM Financial finance receivables, net (including gross consumer finance receivables transferred to SPEs of $6,458 and
$5,773) .............................................................................................. 6,954 5,911
Equity in net assets of nonconsolidated affiliates ............................................................... 6,883 6,790
Property, net ........................................................................................... 24,196 23,005
Goodwill .............................................................................................. 1,973 29,019
Intangible assets, net ..................................................................................... 6,809 10,014
GM Financial equipment on operating leases, net (including assets transferred to SPEs of $540 and $274) ................. 1,649 785
Deferred income taxes .................................................................................... 27,922 512
Other assets ............................................................................................ 2,358 2,416
Total non-current assets .................................................................................. 79,426 79,680
Total Assets ............................................................................................. $149,422 $144,603
LIABILITIES AND EQUITY
Current Liabilities
Accounts payable (principally trade) ........................................................................ $ 25,166 $ 24,551
Short-term debt and current portion of long-term debt ...........................................................
Automotive (including certain debt at VIEs of $228 and $171; Note 15) .......................................... 1,748 1,682
GM Financial ......................................................................................... 3,770 4,118
Accrued liabilities (including derivative liabilities at VIEs of $18 and $44; Note 15) .................................. 23,308 22,875
Total current liabilities ................................................................................... 53,992 53,226
Non-current Liabilities
Long-term debt .........................................................................................
Automotive (including certain debt at VIEs of $122 and $7; Note 15) ............................................ 3,424 3,613
GM Financial ......................................................................................... 7,108 4,420
Postretirement benefits other than pensions ................................................................... 7,309 6,836
Pensions ............................................................................................... 27,420 25,075
Other liabilities and deferred income taxes .................................................................... 13,169 12,442
Total non-current liabilities ................................................................................ 58,430 52,386
Total Liabilities .......................................................................................... 112,422 105,612
Commitments and contingencies (Note 20)
Equity
Preferred stock, $0.01 par value, 2,000,000,000 shares authorized:
Series A (276,101,695 shares issued and outstanding (each with a $25.00 liquidation preference) at December 31, 2012 and
2011) ............................................................................................... 5,536 5,536
Series B (99,988,796 and 100,000,000 shares issued and outstanding (each with a $50.00 liquidation preference) at
December 31, 2012 and 2011) ........................................................................... 4,855 4,855
Common stock, $0.01 par value (5,000,000,000 shares authorized and 1,366,373,526 shares and 1,564,727,289 shares issued and
outstanding at December 31, 2012 and 2011) .................................................................. 14 16
Capital surplus (principally additional paid-in capital) ............................................................ 23,834 26,391
Retained earnings ......................................................................................... 10,057 7,183
Accumulated other comprehensive loss ........................................................................ (8,052) (5,861)
Total stockholders’ equity ................................................................................... 36,244 38,120
Noncontrolling interests .................................................................................... 756 871
Total Equity ............................................................................................. 37,000 38,991
Total Liabilities and Equity ................................................................................ $149,422 $144,603
Reference should be made to the notes to consolidated financial statements.
General Motors Company 2012 ANNUAL REPORT72