Sony 2015 Annual Report Download - page 101
Download and view the complete annual report
Please find page 101 of the 2015 Sony annual report below. You can navigate through the pages in the report by either clicking on the pages listed below, or by using the keyword search tool below to find specific information within the annual report.-
 1
1 -
2
-
3
-
4
-
5
-
6
-
7
-
8
-
9
-
10
-
11
-
12
-
13
-
14
-
15
-
16
-
17
-
18
-
19
-
20
-
21
-
22
-
23
-
24
-
25
-
26
-
27
-
28
-
29
-
30
-
31
-
32
-
33
-
34
-
35
-
36
-
37
-
38
-
39
-
40
-
41
-
42
-
43
-
44
-
45
-
46
-
47
-
48
-
49
-
50
-
51
-
52
-
53
-
54
-
55
-
56
-
57
-
58
-
59
-
60
-
61
-
62
-
63
-
64
-
65
-
66
-
67
-
68
-
69
-
70
-
71
-
72
-
73
-
74
-
75
-
76
-
77
-
78
-
79
-
80
-
81
-
82
-
83
-
84
-
85
-
86
-
87
-
88
-
89
-
90
-
 91
91 -
 92
92 -
 93
93 -
 94
94 -
 95
95 -
 96
96 -
 97
97 -
 98
98 -
 99
99 -
 100
100 -
 101
101 -
 102
102 -
 103
103 -
 104
104 -
 105
105 -
 106
106 -
 107
107 -
 108
108 -
 109
109 -
 110
110 -
 111
111 -
112
-
113
-
114
-
115
-
116
-
117
-
118
-
119
-
120
-
121
-
122
-
123
-
124
-
125
-
126
-
127
-
128
-
129
-
130
-
131
-
132
-
133
-
134
-
135
-
136
-
137
-
138
-
139
-
140
-
141
-
142
-
143
-
144
-
145
-
146
-
147
-
148
-
149
-
150
-
151
-
152
-
153
-
154
-
155
-
156
-
157
-
158
-
159
-
160
-
161
-
162
-
163
-
164
-
165
-
166
-
167
-
168
-
169
-
170
-
171
-
172
-
173
-
174
-
175
-
176
-
177
-
178
-
179
-
180
-
181
-
182
-
183
-
184
-
185
-
186
-
187
-
188
-
189
-
190
-
191
-
192
-
193
-
194
-
195
-
196
-
197
-
198
-
199
-
200
-
201
-
202
-
203
-
204
-
205
-
206
-
207
-
208
-
209
-
210
-
211
-
212
-
213
-
214
-
215
-
216
-
217
-
218
-
219
-
220
-
221
-
222
-
223
-
224
-
225
-
226
-
227
-
228
-
229
-
230
-
231
-
232
 |
 |

D. Employees
As of March 31, 2016, Sony had approximately 125,300 employees, a decrease of approximately
6,400 employees from March 31, 2015. During the fiscal year ended March 31, 2016, while employees of the
Pictures, Music and Financial Services segments increased, the total number of employees decreased due to
production adjustments implemented at manufacturing sites in East Asia (except Japan) and restructuring
initiatives taken mainly in the Mobile Communications (“MC”) segment. As of March 31, 2016, approximately
49,000 employees were located in Japan and approximately 76,300 employees were located outside Japan.
Approximately 23 percent of the total number of employees were members of labor unions.
As of March 31, 2015, Sony had approximately 131,700 employees, a decrease of approximately
9,200 employees from March 31, 2014. During the fiscal year ended March 31, 2015, while employees of the
Pictures, Music and Financial Services segments increased, the total number of employees decreased due to
restructuring initiatives taken mainly in Japan and North America. As of March 31, 2015, approximately
50,000 employees were located in Japan and approximately 81,700 employees were located outside Japan.
Approximately 20 percent of the total number of employees were members of labor unions.
As of March 31, 2014, Sony had approximately 140,900 employees, a decrease of approximately
5,400 employees from March 31, 2013. During the fiscal year ended March 31, 2014, while employees of the
Financial Services and Music segments increased, the total number of employees decreased due to restructuring
initiatives taken in Japan, North America and Europe. As of March 31, 2014, approximately 52,200 employees
were located in Japan and approximately 88,700 employees were located outside Japan. Approximately
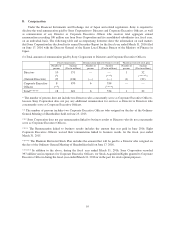
20 percent of the total number of employees were members of labor unions. The following table shows the
number of employees of Sony by segment as of March 31, 2014, 2015 and 2016.
Number of Employees by Segment
March 31
2014 2015 2016
Electronics* ....................................................... 103,600 95,700 88,500
Pictures ........................................................... 7,200 7,600 8,700
Music ............................................................ 7,400 7,500 7,900
Financial Services .................................................. 8,500 8,800 9,400
All Other .......................................................... 6,500 5,700 4,700
Unallocated — Corporate employees ................................... 7,700 6,400 6,100
Total ............................................................. 140,900 131,700 125,300
* The term “Electronics” refers to the sum of the MC, G&NS, IP&S, HE&S and Devices segments.
As of March 31, 2016, the number of employees in Electronics decreased compared to March 31, 2015,
reflecting production adjustments implemented at manufacturing sites in East Asia (except Japan) and
restructuring initiatives taken mainly in the MC segment. The number of employees in All Other also decreased
compared to March 31, 2015, reflecting the decrease of employees in the disc manufacturing business
worldwide. In the Pictures, Music, and Financial Services segments, the number of employees as of March 31,
2016 increased compared to March 31, 2015 due to the expansion of these businesses.
As of March 31, 2015, the number of employees in Electronics decreased compared to March 31, 2014,
reflecting restructuring initiatives taken mainly in Japan and North America. The number of employees in All
Other also decreased compared to March 31, 2014, reflecting the decrease of employees in the disc
manufacturing business worldwide. In the Pictures, Music, and Financial Services segments, the number of
employees as of March 31, 2015 increased compared to March 31, 2014 due to the expansion of these businesses.
As of March 31, 2014, the number of employees in Electronics decreased compared to March 31, 2013,
reflecting restructuring initiatives taken in Japan, North America and Europe. The number of employees in All
Other also decreased compared to March 31, 2013, reflecting the sale of Gracenote Inc. during the fiscal year
101