Sony 2015 Annual Report Download - page 53
Download and view the complete annual report
Please find page 53 of the 2015 Sony annual report below. You can navigate through the pages in the report by either clicking on the pages listed below, or by using the keyword search tool below to find specific information within the annual report.-
 1
1 -
2
-
3
-
4
-
5
-
6
-
7
-
8
-
9
-
10
-
11
-
12
-
13
-
14
-
15
-
16
-
17
-
18
-
19
-
20
-
21
-
22
-
23
-
24
-
25
-
26
-
27
-
28
-
29
-
30
-
31
-
32
-
33
-
34
-
35
-
36
-
37
-
38
-
39
-
40
-
41
-
42
-
 43
43 -
 44
44 -
 45
45 -
 46
46 -
 47
47 -
 48
48 -
 49
49 -
 50
50 -
 51
51 -
 52
52 -
 53
53 -
 54
54 -
 55
55 -
 56
56 -
 57
57 -
 58
58 -
 59
59 -
 60
60 -
 61
61 -
 62
62 -
 63
63 -
64
-
65
-
66
-
67
-
68
-
69
-
70
-
71
-
72
-
73
-
74
-
75
-
76
-
77
-
78
-
79
-
80
-
81
-
82
-
83
-
84
-
85
-
86
-
87
-
88
-
89
-
90
-
91
-
92
-
93
-
94
-
95
-
96
-
97
-
98
-
99
-
100
-
101
-
102
-
103
-
104
-
105
-
106
-
107
-
108
-
109
-
110
-
111
-
112
-
113
-
114
-
115
-
116
-
117
-
118
-
119
-
120
-
121
-
122
-
123
-
124
-
125
-
126
-
127
-
128
-
129
-
130
-
131
-
132
-
133
-
134
-
135
-
136
-
137
-
138
-
139
-
140
-
141
-
142
-
143
-
144
-
145
-
146
-
147
-
148
-
149
-
150
-
151
-
152
-
153
-
154
-
155
-
156
-
157
-
158
-
159
-
160
-
161
-
162
-
163
-
164
-
165
-
166
-
167
-
168
-
169
-
170
-
171
-
172
-
173
-
174
-
175
-
176
-
177
-
178
-
179
-
180
-
181
-
182
-
183
-
184
-
185
-
186
-
187
-
188
-
189
-
190
-
191
-
192
-
193
-
194
-
195
-
196
-
197
-
198
-
199
-
200
-
201
-
202
-
203
-
204
-
205
-
206
-
207
-
208
-
209
-
210
-
211
-
212
-
213
-
214
-
215
-
216
-
217
-
218
-
219
-
220
-
221
-
222
-
223
-
224
-
225
-
226
-
227
-
228
-
229
-
230
-
231
-
232
 |
 |
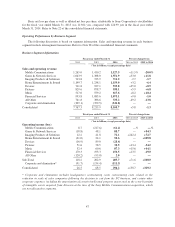
Sales to External Customers by Geographic Area
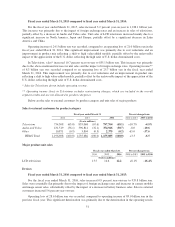
Fiscal year ended March 31, 2016 compared to fiscal year ended March 31, 2015:
Combined sales to external customers by geographic area for the Electronics segments for the fiscal year
ended March 31, 2016 increased year-on-year by 6 percent in Japan, 19 percent in the U.S., decreased year-on-
year by 3 percent in Europe, 3 percent in China, 13 percent in Asia-Pacific areas other than Japan and China (the
“Asia-Pacific Area”) and by 30 percent in other geographic areas (“Other Areas”). Total combined sales in all
areas decreased 3 percent year-on-year.
In Japan, sales of products such as smartphones increased. In the U.S., sales in network services increased.
In Europe, China, the Asia-Pacific Area, and Other Areas, sales of products such as smartphones decreased.
Fiscal year ended March 31, 2015 compared to fiscal year ended March 31, 2014:
Combined sales to external customers by geographic area for the Electronics segments for the fiscal year
ended March 31, 2015 increased year-on-year by 1 percent in Japan, 31 percent in the U.S., 24 percent in Europe,
17 percent in China, 12 percent in Asia-Pacific areas other than Japan and China (the “Asia-Pacific Area”) and
by 1 percent in other geographic areas (“Other Areas”). Total combined sales in all areas increased 15 percent
year-on-year.
In Japan, sales of products such as tablets increased. In the U.S. and Europe, sales in the game business
increased. In China, sales of products such as image sensors and batteries increased. In the Asia-Pacific Area,
sales of products such as image sensors increased. In Other Areas, sales of products such as smartphones
increased while sales of products such as televisions decreased.
Manufacturing by Geographic Area
Fiscal year ended March 31, 2016 compared to fiscal year ended March 31, 2015:
Approximately 61 percent of the Electronics segments’ total annual production during the fiscal year ended
March 31, 2015 was in-house production and approximately 39 percent was outsourced production.
Approximately 37 percent of the annual in-house production took place in Japan, including the production
of semiconductors, professional-use equipment and components such as batteries and storage media.
Approximately 86 percent of the annual in-house production in Japan was destined for other countries.
Production in China accounted for approximately 42 percent of the annual in-house production, approximately
70 percent of which was destined for other countries. Production in Asia, excluding Japan and China, accounted
for approximately 19 percent of the annual in-house production, with approximately 55 percent destined for the
Americas, Japan, Europe and China. Production in the Americas and Europe together accounted for
approximately 1 percent of the annual in-house production, most of which was destined for local distribution and
sale.
Fiscal year ended March 31, 2015 compared to fiscal year ended March 31, 2014:
Approximately 60 percent of the Electronics segments’ total annual production during the fiscal year ended
March 31, 2015 was in-house production and approximately 40 percent was outsourced production.
Approximately 35 percent of the annual in-house production took place in Japan, including the production
of digital cameras, home-use video cameras, LCD televisions, professional-use equipment, semiconductors, and
components such as batteries and storage media. Approximately 75 percent of the annual in-house production in
Japan was destined for other countries. Production in China accounted for approximately 40 percent of the annual
in-house production, approximately 75 percent of which was destined for other countries. Production in Asia,
excluding Japan and China, accounted for approximately 25 percent of the annual in-house production, with
approximately 65 percent destined for the Americas, Japan, Europe and China. Production in the Americas and
Europe together accounted for less than 5 percent of the annual in-house production, most of which was destined
for local distribution and sale.
53