Sony 2015 Annual Report Download - page 177
Download and view the complete annual report
Please find page 177 of the 2015 Sony annual report below. You can navigate through the pages in the report by either clicking on the pages listed below, or by using the keyword search tool below to find specific information within the annual report.-
 1
1 -
2
-
3
-
4
-
5
-
6
-
7
-
8
-
9
-
10
-
11
-
12
-
13
-
14
-
15
-
16
-
17
-
18
-
19
-
20
-
21
-
22
-
23
-
24
-
25
-
26
-
27
-
28
-
29
-
30
-
31
-
32
-
33
-
34
-
35
-
36
-
37
-
38
-
39
-
40
-
41
-
42
-
43
-
44
-
45
-
46
-
47
-
48
-
49
-
50
-
51
-
52
-
53
-
54
-
55
-
56
-
57
-
58
-
59
-
60
-
61
-
62
-
63
-
64
-
65
-
66
-
67
-
68
-
69
-
70
-
71
-
72
-
73
-
74
-
75
-
76
-
77
-
78
-
79
-
80
-
81
-
82
-
83
-
84
-
85
-
86
-
87
-
88
-
89
-
90
-
91
-
92
-
93
-
94
-
95
-
96
-
97
-
98
-
99
-
100
-
101
-
102
-
103
-
104
-
105
-
106
-
107
-
108
-
109
-
110
-
111
-
112
-
113
-
114
-
115
-
116
-
117
-
118
-
119
-
120
-
121
-
122
-
123
-
124
-
125
-
126
-
127
-
128
-
129
-
130
-
131
-
132
-
133
-
134
-
135
-
136
-
137
-
138
-
139
-
140
-
141
-
142
-
143
-
144
-
145
-
146
-
147
-
148
-
149
-
150
-
151
-
152
-
153
-
154
-
155
-
156
-
157
-
158
-
159
-
160
-
161
-
162
-
163
-
164
-
165
-
166
-
 167
167 -
 168
168 -
 169
169 -
 170
170 -
 171
171 -
 172
172 -
 173
173 -
 174
174 -
 175
175 -
 176
176 -
 177
177 -
 178
178 -
 179
179 -
 180
180 -
 181
181 -
 182
182 -
 183
183 -
 184
184 -
 185
185 -
 186
186 -
 187
187 -
188
-
189
-
190
-
191
-
192
-
193
-
194
-
195
-
196
-
197
-
198
-
199
-
200
-
201
-
202
-
203
-
204
-
205
-
206
-
207
-
208
-
209
-
210
-
211
-
212
-
213
-
214
-
215
-
216
-
217
-
218
-
219
-
220
-
221
-
222
-
223
-
224
-
225
-
226
-
227
-
228
-
229
-
230
-
231
-
232
 |
 |

SONY CORPORATION AND CONSOLIDATED SUBSIDIARIES
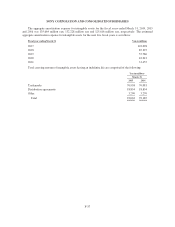
(2) Deposits from customers in the banking business
All deposits from customers in the banking business within the Financial Services segment are interest
bearing deposits. At March 31, 2015 and 2016, the balances of time deposits issued in amounts of 10 million yen
or more were 256,391 million yen and 247,766 million yen, respectively. These amounts have been classified as
current liabilities mainly due to the ability of the customers to make withdrawals prior to maturity.
At March 31, 2016, aggregate amounts of annual maturities of time deposits with a remaining term of more
than one year are as follows:
Fiscal year ending March 31 Yen in millions
2018 13,882
2019 9,101
2020 9,982
2021 13,750
2022 8,626
Later fiscal years 51,827
Total 107,168
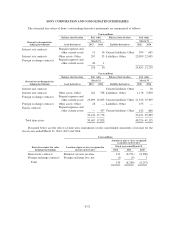
13. Fair value measurements
As discussed in Note 2, assets and liabilities subject to the accounting guidance for fair value measurements
held by Sony are classified and accounted for as described below.
(1) Assets and liabilities that are measured at fair value on a recurring basis
The following section describes the valuation techniques used by Sony to measure different financial
instruments at fair value, including an indication of the level in the fair value hierarchy in which each instrument
is generally classified.
Trading securities, available-for-sale securities and other investments
Where quoted prices are available in an active market, securities are classified in level 1 of the fair value
hierarchy. Level 1 securities include exchange-traded equities. If quoted market prices are not available for the
specific security or the market is inactive, then fair values are estimated by using pricing models, quoted prices of
securities with similar characteristics or discounted cash flows and mainly classified in level 2 of the
hierarchy. Level 2 securities include debt securities with quoted prices that are traded less frequently than
exchange-traded instruments, such as the majority of government bonds and corporate bonds. In certain cases
where there is limited activity or less transparency around inputs to the valuation, securities are classified within
level 3 of the fair value hierarchy. Level 3 securities primarily include certain hybrid financial instruments and
certain private equity investments not classified within level 1 or level 2.
Derivatives
Exchange-traded derivatives valued using quoted prices are classified within level 1 of the fair value
hierarchy. However, few classes of derivative contracts are listed on an exchange; thus, the majority of Sony’s
derivative positions are valued using internally developed models that use as their basis readily observable
market parameters – i.e., parameters that are actively quoted and can be validated to external sources, including
industry pricing services. Depending on the types and contractual terms of derivatives, fair value can be modeled
using a series of techniques, such as the Black-Scholes option pricing model, which are consistently
F-43