Sony 2015 Annual Report Download - page 194
Download and view the complete annual report
Please find page 194 of the 2015 Sony annual report below. You can navigate through the pages in the report by either clicking on the pages listed below, or by using the keyword search tool below to find specific information within the annual report.-
 1
1 -
2
-
3
-
4
-
5
-
6
-
7
-
8
-
9
-
10
-
11
-
12
-
13
-
14
-
15
-
16
-
17
-
18
-
19
-
20
-
21
-
22
-
23
-
24
-
25
-
26
-
27
-
28
-
29
-
30
-
31
-
32
-
33
-
34
-
35
-
36
-
37
-
38
-
39
-
40
-
41
-
42
-
43
-
44
-
45
-
46
-
47
-
48
-
49
-
50
-
51
-
52
-
53
-
54
-
55
-
56
-
57
-
58
-
59
-
60
-
61
-
62
-
63
-
64
-
65
-
66
-
67
-
68
-
69
-
70
-
71
-
72
-
73
-
74
-
75
-
76
-
77
-
78
-
79
-
80
-
81
-
82
-
83
-
84
-
85
-
86
-
87
-
88
-
89
-
90
-
91
-
92
-
93
-
94
-
95
-
96
-
97
-
98
-
99
-
100
-
101
-
102
-
103
-
104
-
105
-
106
-
107
-
108
-
109
-
110
-
111
-
112
-
113
-
114
-
115
-
116
-
117
-
118
-
119
-
120
-
121
-
122
-
123
-
124
-
125
-
126
-
127
-
128
-
129
-
130
-
131
-
132
-
133
-
134
-
135
-
136
-
137
-
138
-
139
-
140
-
141
-
142
-
143
-
144
-
145
-
146
-
147
-
148
-
149
-
150
-
151
-
152
-
153
-
154
-
155
-
156
-
157
-
158
-
159
-
160
-
161
-
162
-
163
-
164
-
165
-
166
-
167
-
168
-
169
-
170
-
171
-
172
-
173
-
174
-
175
-
176
-
177
-
178
-
179
-
180
-
181
-
182
-
183
-
 184
184 -
 185
185 -
 186
186 -
 187
187 -
 188
188 -
 189
189 -
 190
190 -
 191
191 -
 192
192 -
 193
193 -
 194
194 -
 195
195 -
 196
196 -
 197
197 -
 198
198 -
 199
199 -
 200
200 -
 201
201 -
 202
202 -
 203
203 -
 204
204 -
205
-
206
-
207
-
208
-
209
-
210
-
211
-
212
-
213
-
214
-
215
-
216
-
217
-
218
-
219
-
220
-
221
-
222
-
223
-
224
-
225
-
226
-
227
-
228
-
229
-
230
-
231
-
232
 |
 |

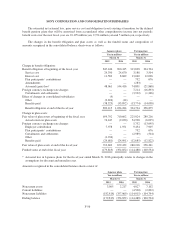
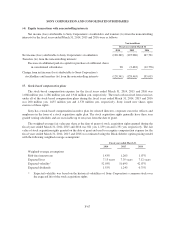
SONY CORPORATION AND CONSOLIDATED SUBSIDIARIES
*5 Commingled funds represent pooled institutional investments, including primarily investment trusts. They
include approximately 46 percent and 44 percent of investments in equity, 52 percent and 54 percent of
investments in fixed income, and 3 percent and 1 percent of investments in other for the fiscal years ended
March 31, 2015 and 2016, respectively.
*6 Represents commodity futures funds.
*7 Includes multiple private equity funds of funds that primarily invest in venture, buyout, and distressed
markets in the U.S. and Europe.
*8 Includes primarily funds that invest in a portfolio of a broad range of hedge funds to diversify the risks and
reduce the volatilities associated with a single hedge fund.
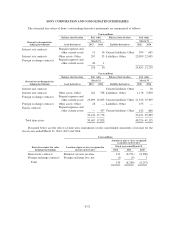
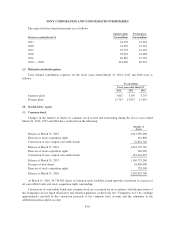
Foreign plans
Yen in millions
Fair value
at March 31,
2015
Fair value measurements
using inputs considered as
Asset class Level 1 Level 2 Level 3
Cash and cash equivalents 8,665 8,665 — —
Equity:
Equity securities*1 44,276 41,194 3,082 —
Fixed income:
Government bonds*2 69,882 — 69,882 —
Corporate bonds*3 33,290 — 25,906 7,384
Asset-backed securities 328 — 328 —
Insurance contracts*4 1,936 — 1,936 —
Commingled funds*5 86,931 — 86,931 —
Real estate and other*6 34,908 — 19,386 15,522
Total 280,216 49,859 207,451 22,906
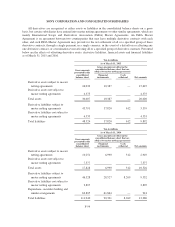
Foreign plans
Yen in millions
Fair value
at March 31,
2016
Fair value measurements
using inputs considered as
Asset class Level 1 Level 2 Level 3
Cash and cash equivalents 4,078 4,078 — —
Equity:
Equity securities*1 37,769 35,818 1,951 —
Fixed income:
Government bonds*2 60,835 — 60,835 —
Corporate bonds*3 30,425 — 23,425 7,000
Asset-backed securities 321 — 321 —
Insurance contracts*4 4,293 — 4,293 —
Commingled funds*5 77,456 — 77,456 —
Real estate and other*6 41,164 — 17,040 24,124
Total 256,341 39,896 185,321 31,124
*1 Includes primarily foreign equity securities.
*2 Includes primarily foreign government debt securities.
*3 Includes primarily foreign corporate debt securities.
F-60